Fig. 4
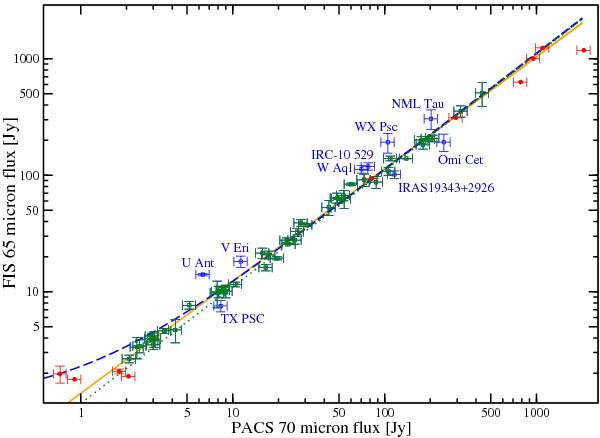
AKARI/FIS 65 μm flux density plotted against PACS 70 μm flux density. The blue dashed line shows the best linear regression, after 3σ outlier (blue open squares) rejection (y = 1.3 + 1.1·x), while the orange solid lines is the best fit using a power law relation (y = 1.3 x0.96). The former fits were not constrained to go through the origin. The dotted green line represents the nominal flux ratio of an A0 star for effective wavelengths of 62.8 and 68.8 for FIS and PACS, respectively. Objects indicated with red filled circles were omitted from the fit due to low quality flag in the FIS catalog.
Current usage metrics show cumulative count of Article Views (full-text article views including HTML views, PDF and ePub downloads, according to the available data) and Abstracts Views on Vision4Press platform.
Data correspond to usage on the plateform after 2015. The current usage metrics is available 48-96 hours after online publication and is updated daily on week days.
Initial download of the metrics may take a while.