Fig. 2
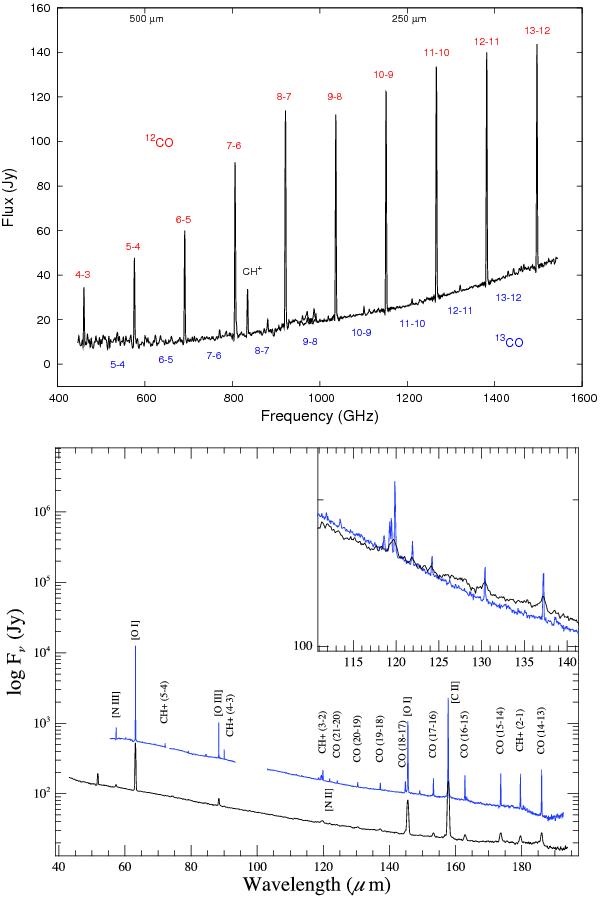
Top panel: SPIRE FTS spectrum of NGC 7027 (Wesson et al. 2010b), with 12CO, 13CO and CH+ lines indicated. Bottom panel: PACS spectrum of NGC 7027 (Exter et al., in prep.; the blue upper curve) with the strongest lines indicated, and the ISO LWS spectrum (black, lower curve) of Liu et al. (1996) scaled by a factor of 0.25 in flux. The inset shows a detail of the spectrum (with no scaling in flux) illustrating the improved resolution of the PACS spectrum w.r.t. the LWS spectrum.
Current usage metrics show cumulative count of Article Views (full-text article views including HTML views, PDF and ePub downloads, according to the available data) and Abstracts Views on Vision4Press platform.
Data correspond to usage on the plateform after 2015. The current usage metrics is available 48-96 hours after online publication and is updated daily on week days.
Initial download of the metrics may take a while.