Free Access
Fig. 1
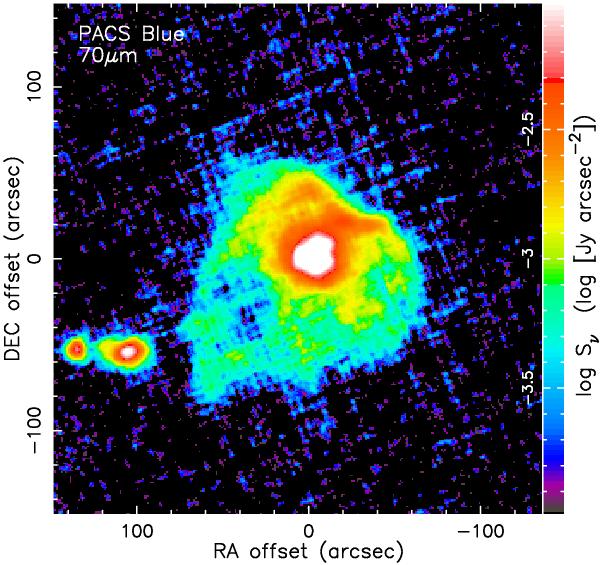
The map of X Her at 70 μm displayed on a logarithmic intensity scale. North is to the top, east to the left. To the south east of X Her are a pair of galaxies (UGC10156a and b).
Current usage metrics show cumulative count of Article Views (full-text article views including HTML views, PDF and ePub downloads, according to the available data) and Abstracts Views on Vision4Press platform.
Data correspond to usage on the plateform after 2015. The current usage metrics is available 48-96 hours after online publication and is updated daily on week days.
Initial download of the metrics may take a while.