Fig. 2
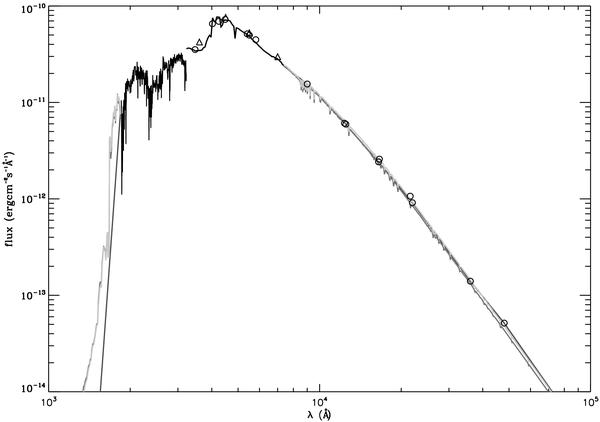
The whole spectrum obtained for γ Equ. Black line corresponds to the average of the IUE spectra and to the Kharitonov et al. (1988)’s spectrum. For wavelengths λ < 1854 Å and λ > 7390 Å, the figure shows the curve obtained using the interpolation method (dark gray line), the Kurucz model that best fits the spectroscopy in the visible and the photometry in the infrared when models are calibrated with the star’s magnitude mV (gray line) and when models are calibrated with the relation (R/d)2 (light gray line). The Geneva and infrared photometry from Table 4 (circles) and Johnson UBVRI photometry (triangles) are overplotted to the spectrum.
Current usage metrics show cumulative count of Article Views (full-text article views including HTML views, PDF and ePub downloads, according to the available data) and Abstracts Views on Vision4Press platform.
Data correspond to usage on the plateform after 2015. The current usage metrics is available 48-96 hours after online publication and is updated daily on week days.
Initial download of the metrics may take a while.