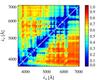
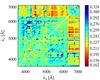
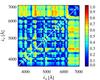
Fig. 7
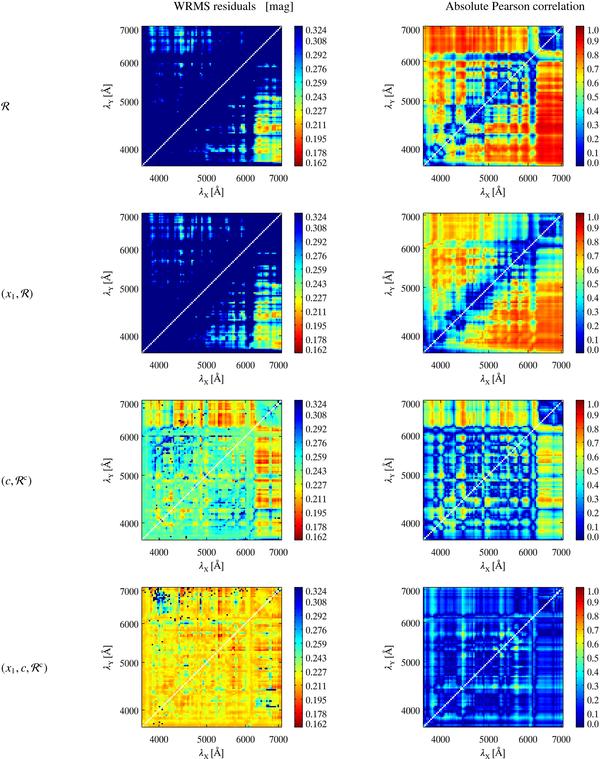
Results from 10-fold cross-validation on maximum-light spectra. From top to bottom: ℛ only; (x1,ℛ); (c,ℛc); (x1,c,ℛc). The left column is color-coded according to the weighted rms of prediction Hubble residuals, while the right column corresponds to the absolute Pearson cross-correlation coefficient of the correction terms with uncorrected Hubble residuals.
Current usage metrics show cumulative count of Article Views (full-text article views including HTML views, PDF and ePub downloads, according to the available data) and Abstracts Views on Vision4Press platform.
Data correspond to usage on the plateform after 2015. The current usage metrics is available 48-96 hours after online publication and is updated daily on week days.
Initial download of the metrics may take a while.