Fig. 5
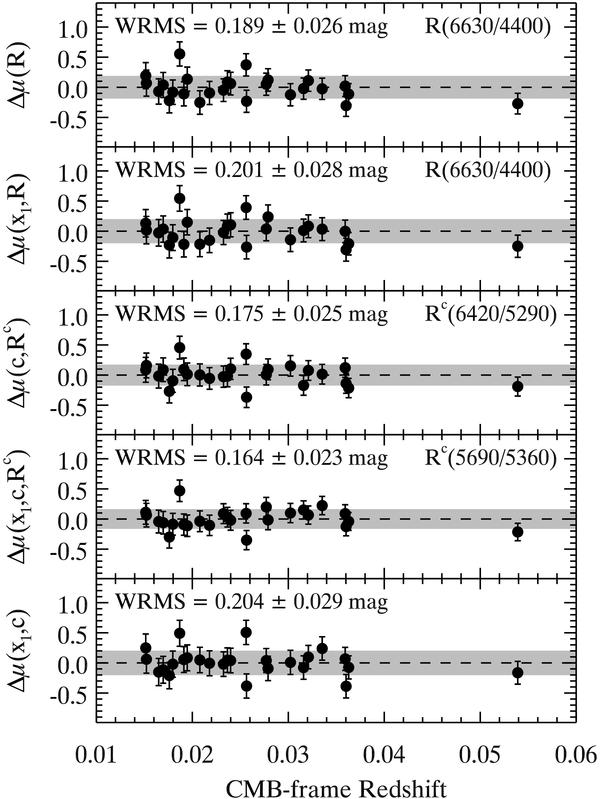
Hubble diagram residuals for the highest-ranked flux ratios at maximum light. From top to bottom: prediction residuals using ℛ only; (ℛ,x1); (ℛc,c); (ℛc,x1,c); and using the standard SALT2 fit parameters (x1,c). In each case we indicate the weighted rms of prediction Hubble residuals (gray highlighted region).
Current usage metrics show cumulative count of Article Views (full-text article views including HTML views, PDF and ePub downloads, according to the available data) and Abstracts Views on Vision4Press platform.
Data correspond to usage on the plateform after 2015. The current usage metrics is available 48-96 hours after online publication and is updated daily on week days.
Initial download of the metrics may take a while.