Fig. 17
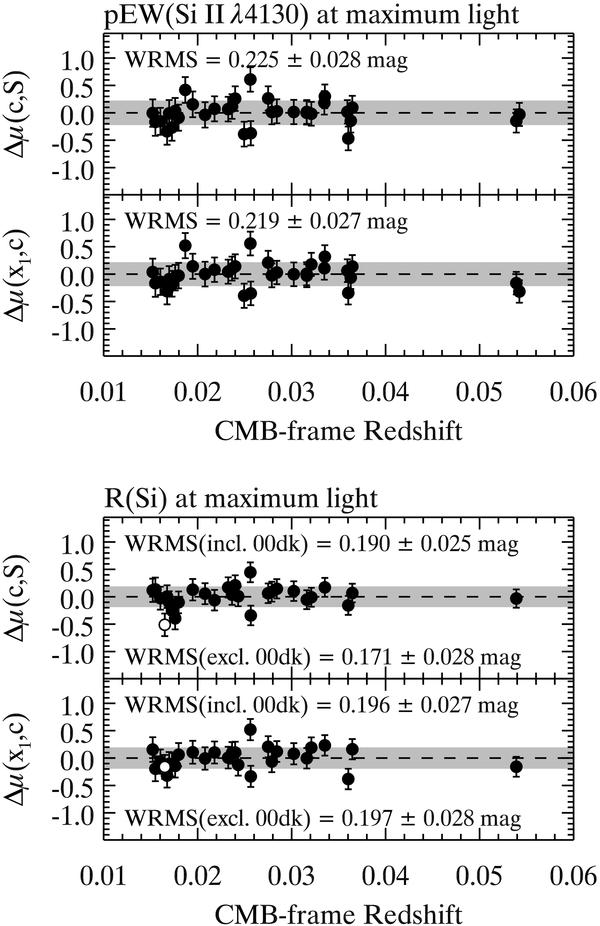
Hubble diagram residuals for pEW(Si ii λ4130) (top) and ℛ(Si) (bottom) at maximum light. In each case we show the Hubble residuals obtained using SALT2 color and the spectroscopic indicator (upper panels), and using the standard SALT2 fit parameters (x1,c) (lower panels). We also indicate the weighted rms of Hubble residuals (gray highlighted region). For the ℛ(Si) spectroscopic indicator, we report the weighted rms both including and excluding SN 2000dk (open circle).
Current usage metrics show cumulative count of Article Views (full-text article views including HTML views, PDF and ePub downloads, according to the available data) and Abstracts Views on Vision4Press platform.
Data correspond to usage on the plateform after 2015. The current usage metrics is available 48-96 hours after online publication and is updated daily on week days.
Initial download of the metrics may take a while.