Fig. 15
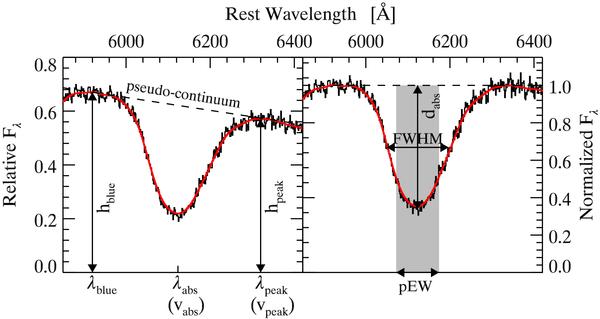
Definition of the main spectroscopic indicators used in this paper, here illustrated using the Si iiλ6355 line profile in the spectrum of SN 2005ki at t = +1 d. The right panel shows the pseudo-continuum (dashed line), as well as the wavelength locations of the blue and red emission peaks (λblue and λpeak) and their respective heights (hblue and hpeak). The wavelength of maximum absorption (λabs) serves to define the absorption velocity, vabs. The peak velocity vpeak is defined analogously. The left panel shows the same line profile normalized to the pseudo-continuum, and serves to define the (relative) absorption depth (dabs), FWHM, and pseudo-equivalent width (pEW; shaded gray region). In both panels, the thick line corresponds to the smoothed flux, where we have used the inverse-variance weighted Gaussian filter of Blondin et al. (2006) with a smoothing factor dλ/λ = 0.005.
Current usage metrics show cumulative count of Article Views (full-text article views including HTML views, PDF and ePub downloads, according to the available data) and Abstracts Views on Vision4Press platform.
Data correspond to usage on the plateform after 2015. The current usage metrics is available 48-96 hours after online publication and is updated daily on week days.
Initial download of the metrics may take a while.