Fig. 10
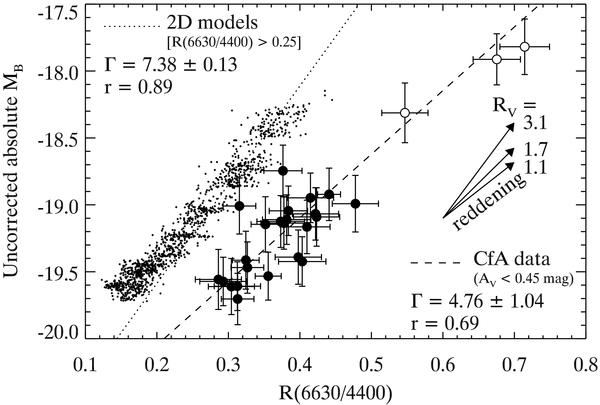
Absolute rest-frame B-band magnitude (MB) vs. flux ratio ℛ(6630/4400) at maximum light in 2D SN Ia models of Kasen et al. (2009) (small dots), and in data from the CfA SN Ia sample (AV < 0.45 mag: filled circles, AV > 0.45 mag: open circles). The dotted and dashed lines are linear fits to the models and data, respectively, where models for which ℛ(6630/4400) > 0.25 and data for which AV > 0.45 mag have been excluded from the fit. The slope (Γ) and Pearson correlation coefficient (r) are indicated for both cases. The data have been offset vertically for clarity. Including models for which ℛ(6630/4400) < 0.25 results in Γ = 5.71 ± 0.03 and r = 0.97, while including data with AV > 0.45 mag results in Γ = 4.43 ± 0.47 and r = 0.92. The arrows indicate approximate reddening vectors for different values of RV.
Current usage metrics show cumulative count of Article Views (full-text article views including HTML views, PDF and ePub downloads, according to the available data) and Abstracts Views on Vision4Press platform.
Data correspond to usage on the plateform after 2015. The current usage metrics is available 48-96 hours after online publication and is updated daily on week days.
Initial download of the metrics may take a while.