Fig. 1
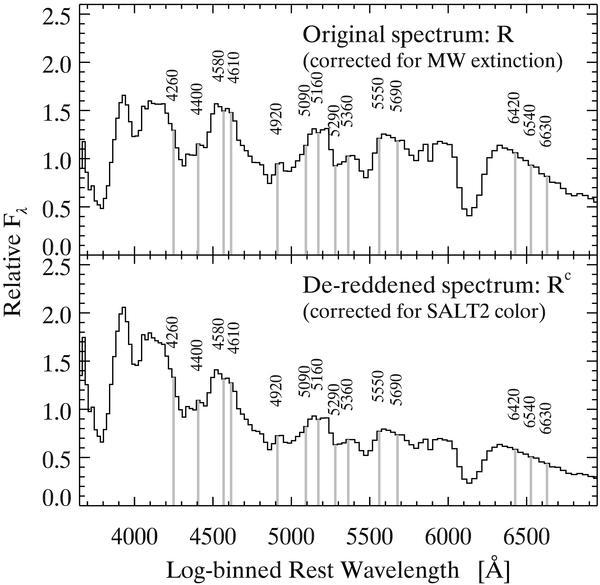
Illustration of the flux ratio measurement. The upper panel shows the input spectrum (de-redshifted and corrected for Galactic reddening; here SN 1999gd around maximum light), binned on a log-wavelength scale. The gray vertical lines represent the fluxes in characteristic wavelength bins mentioned throughout the text. The lower panel shows the same spectrum corrected for SALT2 color, which is used to measure the color-corrected flux ratios ℛc.
Current usage metrics show cumulative count of Article Views (full-text article views including HTML views, PDF and ePub downloads, according to the available data) and Abstracts Views on Vision4Press platform.
Data correspond to usage on the plateform after 2015. The current usage metrics is available 48-96 hours after online publication and is updated daily on week days.
Initial download of the metrics may take a while.