Fig. 9
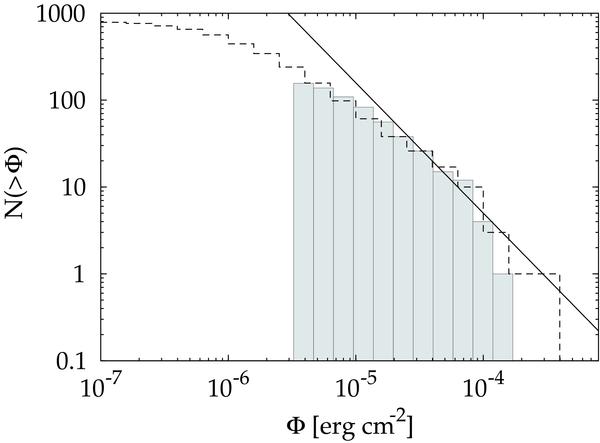
Cumulative fluence distribution for the subset of GRBs with a relative error on fluence below 20% (shaded histogram). The dashed histogram is the corresponding fluence distribution published by F09 for the entire GRBM catalogue of GRBs, as derived from 2-channel spectra. The solid line shows the power law distribution with index −3/2 expected if GRBs were homogeneously distributed in an Euclidean space throughout the sampled volume.
Current usage metrics show cumulative count of Article Views (full-text article views including HTML views, PDF and ePub downloads, according to the available data) and Abstracts Views on Vision4Press platform.
Data correspond to usage on the plateform after 2015. The current usage metrics is available 48-96 hours after online publication and is updated daily on week days.
Initial download of the metrics may take a while.