Free Access
Fig. 6
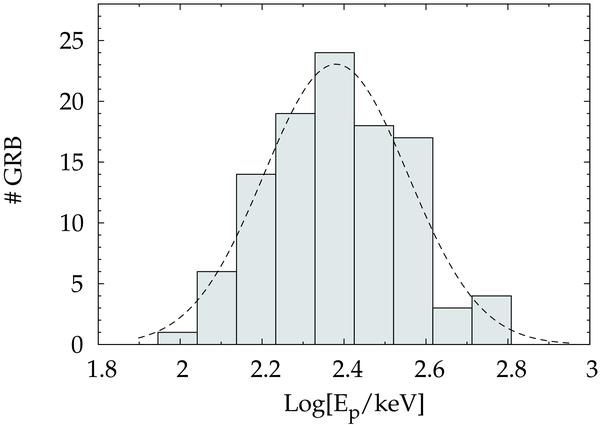
Peak energy distribution derived with the cpl model for a sample of 106 GRBs with a relative uncertainty smaller than 40%. The dashed line shows the best-fitting normal distribution.
Current usage metrics show cumulative count of Article Views (full-text article views including HTML views, PDF and ePub downloads, according to the available data) and Abstracts Views on Vision4Press platform.
Data correspond to usage on the plateform after 2015. The current usage metrics is available 48-96 hours after online publication and is updated daily on week days.
Initial download of the metrics may take a while.