Free Access
Fig. 15
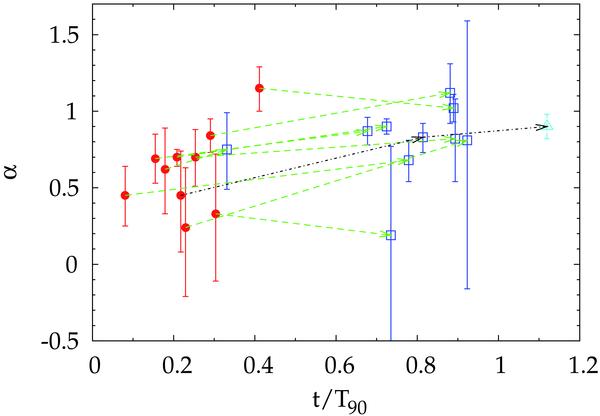
Low-energy photon index as a function of time expressed in units of T90 for a subset of GRBs sampled by multiple spectral intervals. Filled circles, empty squares, and triangles correspond to the spectra A, B, and C, respectively. Each arrow tracks the evolution of a given GRB.
Current usage metrics show cumulative count of Article Views (full-text article views including HTML views, PDF and ePub downloads, according to the available data) and Abstracts Views on Vision4Press platform.
Data correspond to usage on the plateform after 2015. The current usage metrics is available 48-96 hours after online publication and is updated daily on week days.
Initial download of the metrics may take a while.