Fig. 1
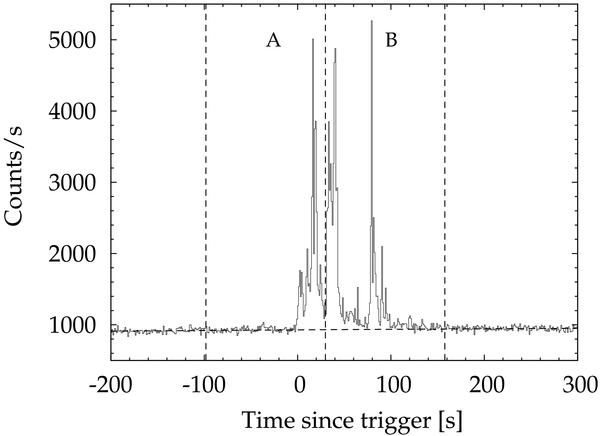
1-s light curve of GRB 000226 detected with GRBM unit 2 in the 40–700 keV band shown as an example. The dashed horizontal line shows the parabolic fit to the background. The vertical lines mark the time intervals corresponding to the 128-s spectra continuously acquired. Spectra “A” and “B” include the GRB, while the adjacent intervals are used to interpolate the background in each channel.
Current usage metrics show cumulative count of Article Views (full-text article views including HTML views, PDF and ePub downloads, according to the available data) and Abstracts Views on Vision4Press platform.
Data correspond to usage on the plateform after 2015. The current usage metrics is available 48-96 hours after online publication and is updated daily on week days.
Initial download of the metrics may take a while.