Fig. 4
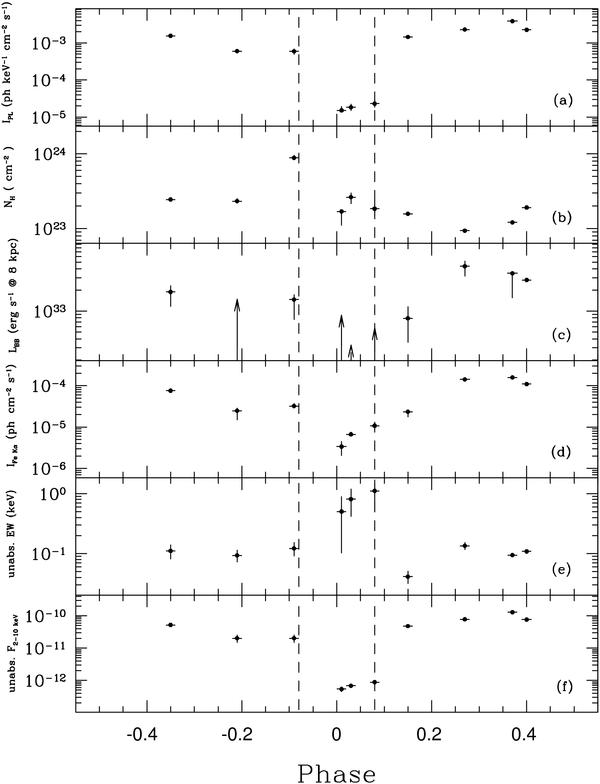
Spectral variability along the orbit illustrated by a) the cut-off power-law normalization at 1 keV, b) the intrinsic hydrogen column density, c) the soft excess blackbody luminosity, assuming a distance of 8 kpc, d) the iron line flux, e) the iron line equivalent width calculated for the unabsorbed continuum, and f) the unabsorbed flux. Dashed vertical lines indicate the eclipse boundary.
Current usage metrics show cumulative count of Article Views (full-text article views including HTML views, PDF and ePub downloads, according to the available data) and Abstracts Views on Vision4Press platform.
Data correspond to usage on the plateform after 2015. The current usage metrics is available 48-96 hours after online publication and is updated daily on week days.
Initial download of the metrics may take a while.