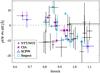
Fig. 11
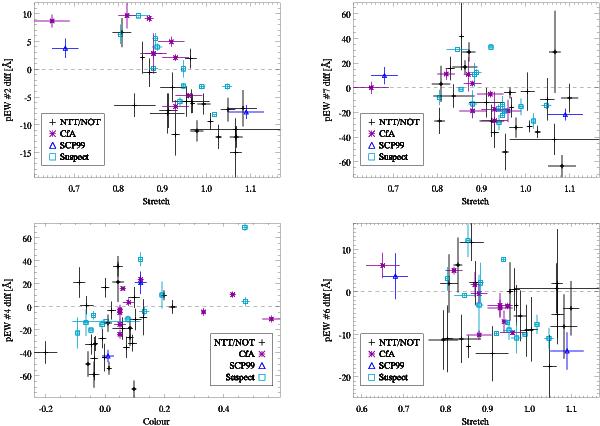
These correlation studies show the measured pEW minus the expected pEW for the corresponding epoch for the full sample of normal SNe Ia vs. SALT lightcurve parameter (stretch, colour) for epoch ranges around peak (±3 days). Indicators chosen are the ones showing largest correlation for this epoch range.
Current usage metrics show cumulative count of Article Views (full-text article views including HTML views, PDF and ePub downloads, according to the available data) and Abstracts Views on Vision4Press platform.
Data correspond to usage on the plateform after 2015. The current usage metrics is available 48-96 hours after online publication and is updated daily on week days.
Initial download of the metrics may take a while.