Fig. 6
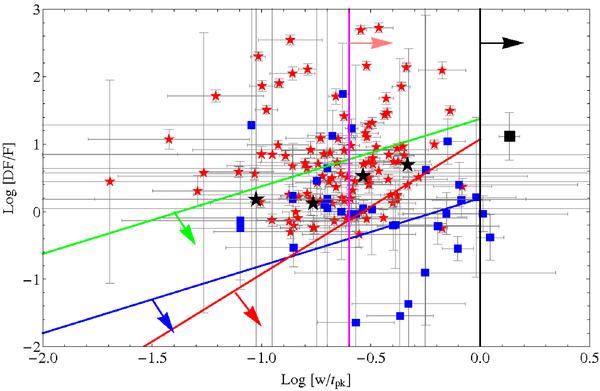
Increase of the flux with respect to the underlying continuum vs. temporal variability for the sample of late flares (blue squares) compared with the early flare sample (red stars). The black stars and square correspond to the SGRB early-time and late-time flares, respectively. The solid lines limit the kinematically allowed regions for density fluctuations on-axis (blue line) and off-axis (red line), for off-axis multiple regions density fluctuations (green line), for patchy shell model (black line) and for refreshed shocks (pink line), see Ioka et al. (2005) for details.
Current usage metrics show cumulative count of Article Views (full-text article views including HTML views, PDF and ePub downloads, according to the available data) and Abstracts Views on Vision4Press platform.
Data correspond to usage on the plateform after 2015. The current usage metrics is available 48-96 hours after online publication and is updated daily on week days.
Initial download of the metrics may take a while.