Fig. 4
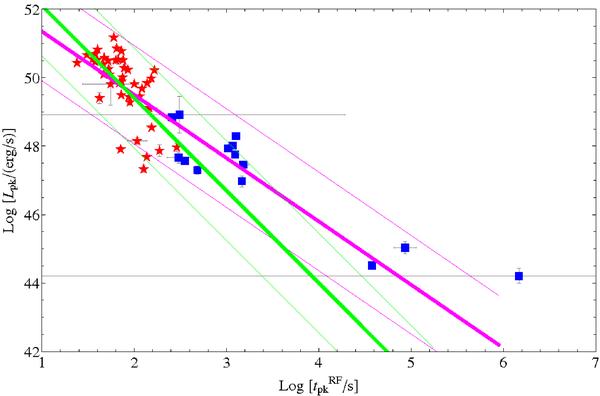
Peak luminosity vs. peak time measured in the rest frame for the 14 late-time flares with measured redshift (blue squares) compared with the early-time flare sample (red stars). The best fit for the whole sample accounting for the extrinsic scatter is Log [Lpk] = (53.2 ± 0.3) + (−1.8 ± 0.1) Log [tpk] with σext = (0.72 ± 0.07) (pink line). The best fit for early-time flares accounting for the extrinsic scatter Log [Lpk] = (54.8 ± 4.0) + (−2.7 ± 0.5) Log [tpk] with σext = (0.73 ± 0.08) (green line) is shown for comparison. The thinner lines indicate the 2σ regions for the two best-fit relations.
Current usage metrics show cumulative count of Article Views (full-text article views including HTML views, PDF and ePub downloads, according to the available data) and Abstracts Views on Vision4Press platform.
Data correspond to usage on the plateform after 2015. The current usage metrics is available 48-96 hours after online publication and is updated daily on week days.
Initial download of the metrics may take a while.