Fig. 3
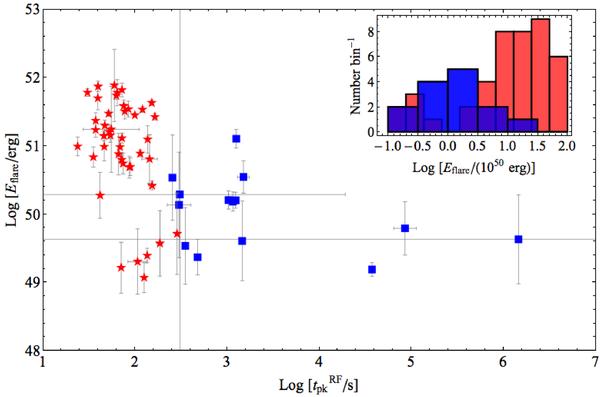
Isotropic energy emitted in the observer 0.3−10 keV energy band vs. rest frame peak time for the sample of late-time flares (blue squares) compared with the early-time flare sample (red stars). The absence of energetic late-time flares is manifest. Inset: distribution of the logarithm of the isotropic energy emitted in the 0.3−10 keV energy band of late-time flares (blue rectangles) compared with the early-time flare one (red rectangles). The late-time flares are clearly less energetic than the early-time ones, with a median for the distribution of the energy 1.4 × 1050 erg and standard deviation σ = 3.2 × 1050 erg.
Current usage metrics show cumulative count of Article Views (full-text article views including HTML views, PDF and ePub downloads, according to the available data) and Abstracts Views on Vision4Press platform.
Data correspond to usage on the plateform after 2015. The current usage metrics is available 48-96 hours after online publication and is updated daily on week days.
Initial download of the metrics may take a while.