Fig. 1
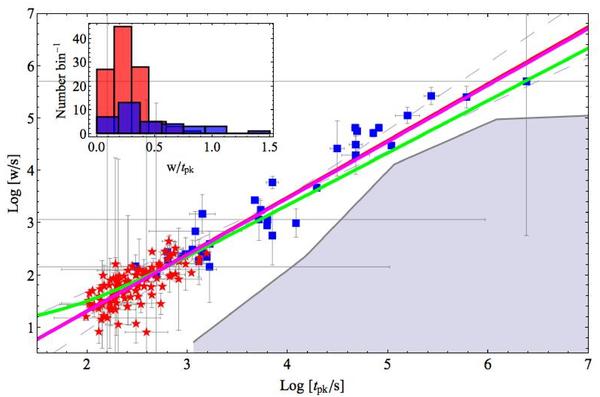
Width vs. peak time for the sample of late-time flares (blue squares) compared with early-time flare sample (red stars). Green line: linear (w = 10. + 0.2 tpk) behaviour found in the early flare sample. Pink line: best-fit for the late flares sample, 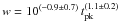 . Grey area: region of the w − tpk plane that cannot be explored in our analysis. Inset: distribution of the ratio w/tpk of late-time flares (blue rectangles) compared with the early-time flare one (red rectangles). The two distributions are centred on a similar value (the median is 0.28 for the late-time flares and 0.23 for the early-time flares), but late-time flares have a higher standard deviation (σ = 0.33 compared with σ = 0.14).
Current usage metrics show cumulative count of Article Views (full-text article views including HTML views, PDF and ePub downloads, according to the available data) and Abstracts Views on Vision4Press platform.
Data correspond to usage on the plateform after 2015. The current usage metrics is available 48-96 hours after online publication and is updated daily on week days.
Initial download of the metrics may take a while.