Fig. 2
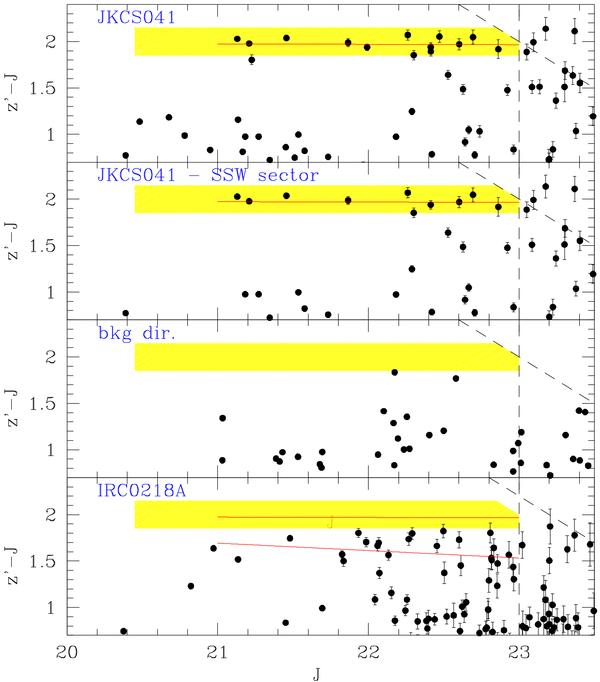
Color–magnitude plots. Top panel: in the direction of JKCS 041; top-middle panel: toward JKCS 041 once the SSW octant has been flagged because contaminated by a nearby structure, see text. Middle-bottom panel: in a control area of the same solid angle as the top panel; bottom panel: toward IRC0218A. Solid lines shows the fitted color-magnitude relations of the two clusters, whereas shading indicates the simpler color range 1.85 < z′ − J < 2.15. Slanted and vertical dashed lines indicate magnitudes where the S/N = 15 in J (vertical) or z′ (diagonal), and therefore delimit the region where catalogs should be complete. JKCS 041 red sequence galaxies are 0.32 mag redder than the red sequence of IRC0218A, at z = 1.62, indicating that JKCS 041 is at z ≫ 1.62.
Current usage metrics show cumulative count of Article Views (full-text article views including HTML views, PDF and ePub downloads, according to the available data) and Abstracts Views on Vision4Press platform.
Data correspond to usage on the plateform after 2015. The current usage metrics is available 48-96 hours after online publication and is updated daily on week days.
Initial download of the metrics may take a while.