Fig. 2
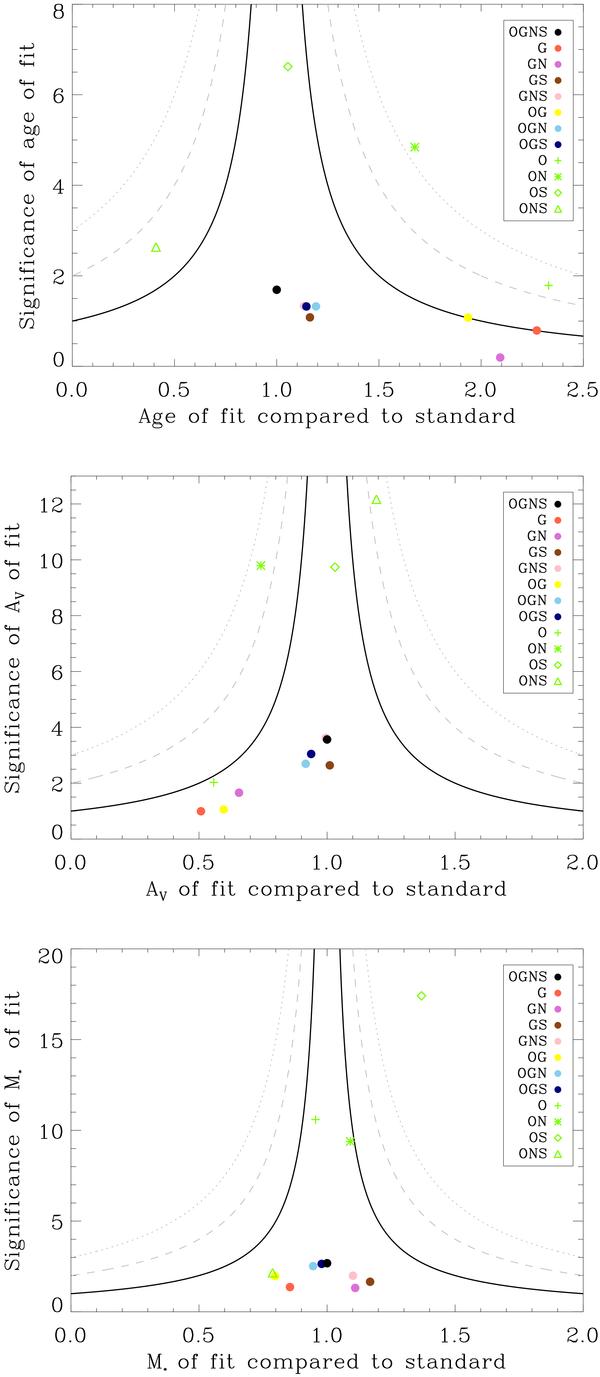
Test of the importance of various photometric bands for the fitting. The three plots are shown for the parameters age, AV and stellar mass, from top to bottom. The x-axes show the value for each fit normalised to the value obtained with all filter passbands used (OGNS, black points). The y-axes show the value in each fit divided by the error bar on that value, indicating how well determined the value is. The various passbands included are UV/optical (“O”), grism (“G”), near-infrared (“N”) and Spitzer/Ch1 (“S”). The solid, dashed, and dotted line indicates the area within which points are within 1, 2, and 3σ of the OGNS value.
Current usage metrics show cumulative count of Article Views (full-text article views including HTML views, PDF and ePub downloads, according to the available data) and Abstracts Views on Vision4Press platform.
Data correspond to usage on the plateform after 2015. The current usage metrics is available 48-96 hours after online publication and is updated daily on week days.
Initial download of the metrics may take a while.