Free Access
Fig. 3
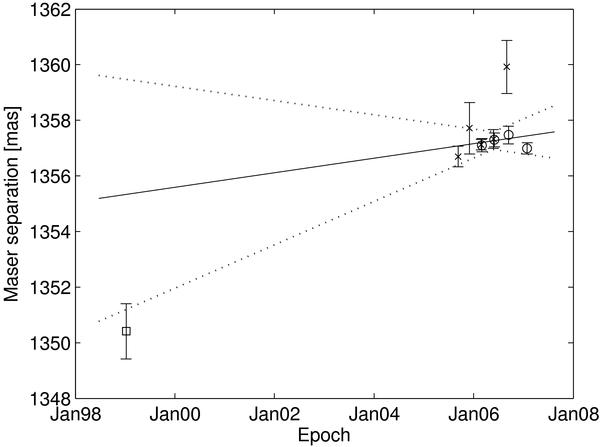
Separation of the 12.2 GHz maser clumps in mas. Our four epochs are marked as circles, also shown are previous measurements by Min01 (square) and Mos09 (crosses). The solid line indicates our best fit and the dotted lines the errors of the fit.
Current usage metrics show cumulative count of Article Views (full-text article views including HTML views, PDF and ePub downloads, according to the available data) and Abstracts Views on Vision4Press platform.
Data correspond to usage on the plateform after 2015. The current usage metrics is available 48-96 hours after online publication and is updated daily on week days.
Initial download of the metrics may take a while.