Fig. 6
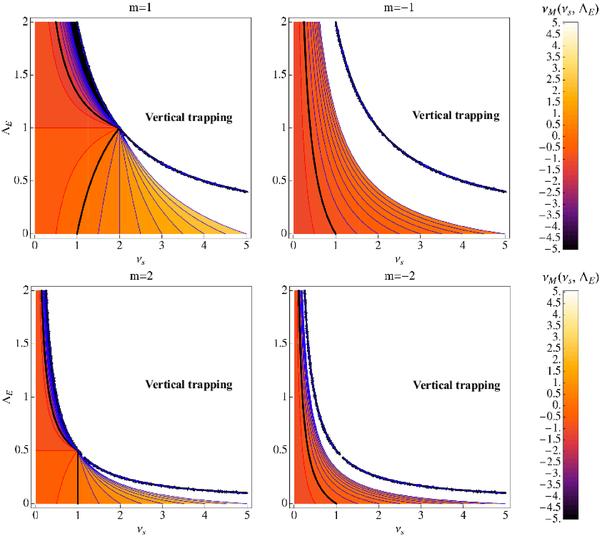
Top: νM as a function of
νs and ΛE for non-axisymmetric retrograde
(m = 1) and prograde (m = −1) waves. The
surfaces such that |νM| = 1 are given by the thick
black lines and the iso-νM lines for
|νM| < 1 and
|νM| > 1 are given by
the red and the blue lines. The big external white region in the top-right corner
in each case corresponds to the  domain where
  ,
the wave being thus vertically trapped there. The MHD TA applies when
|νM| < 1 and
,
the wave being thus vertically trapped there. The MHD TA applies when
|νM| < 1 and
 (red lines). In the other case (blue and black lines, i.e.
| νM | ≥ 1 and
),
it does not apply due to the singularity at the critical latitude
(θc) given in Eq. (88) and plotted in Fig. (7). Bottom: same for m = 2 and
m = −2.
(red lines). In the other case (blue and black lines, i.e.
| νM | ≥ 1 and
),
it does not apply due to the singularity at the critical latitude
(θc) given in Eq. (88) and plotted in Fig. (7). Bottom: same for m = 2 and
m = −2.
Current usage metrics show cumulative count of Article Views (full-text article views including HTML views, PDF and ePub downloads, according to the available data) and Abstracts Views on Vision4Press platform.
Data correspond to usage on the plateform after 2015. The current usage metrics is available 48-96 hours after online publication and is updated daily on week days.
Initial download of the metrics may take a while.