Fig. 1
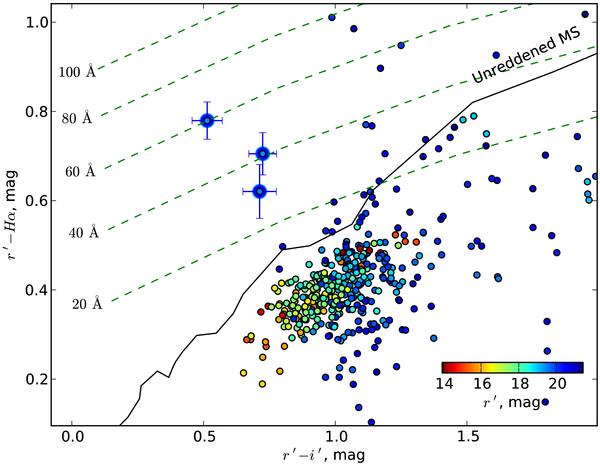
Colour–colour diagram of the IPHAS detections (not sources) in the 1.3 arcmin field around ASCA coordinates of AX J194939+2631. Objects with Hα excess are located towards the top of the diagram. The r′ magnitude is colour-coded. Black solid line indicates unreddened main sequence, while green dashed lines are those of constant HαEW with corresponding values labelled on the left (from Drew et al. 2005). Three detections of IPHAS J194938.39+263149.2 marked with larger circles correspond to the only prominent Hα emitter in the field. Error bars given for it are applicable to other detections as well.
Current usage metrics show cumulative count of Article Views (full-text article views including HTML views, PDF and ePub downloads, according to the available data) and Abstracts Views on Vision4Press platform.
Data correspond to usage on the plateform after 2015. The current usage metrics is available 48-96 hours after online publication and is updated daily on week days.
Initial download of the metrics may take a while.