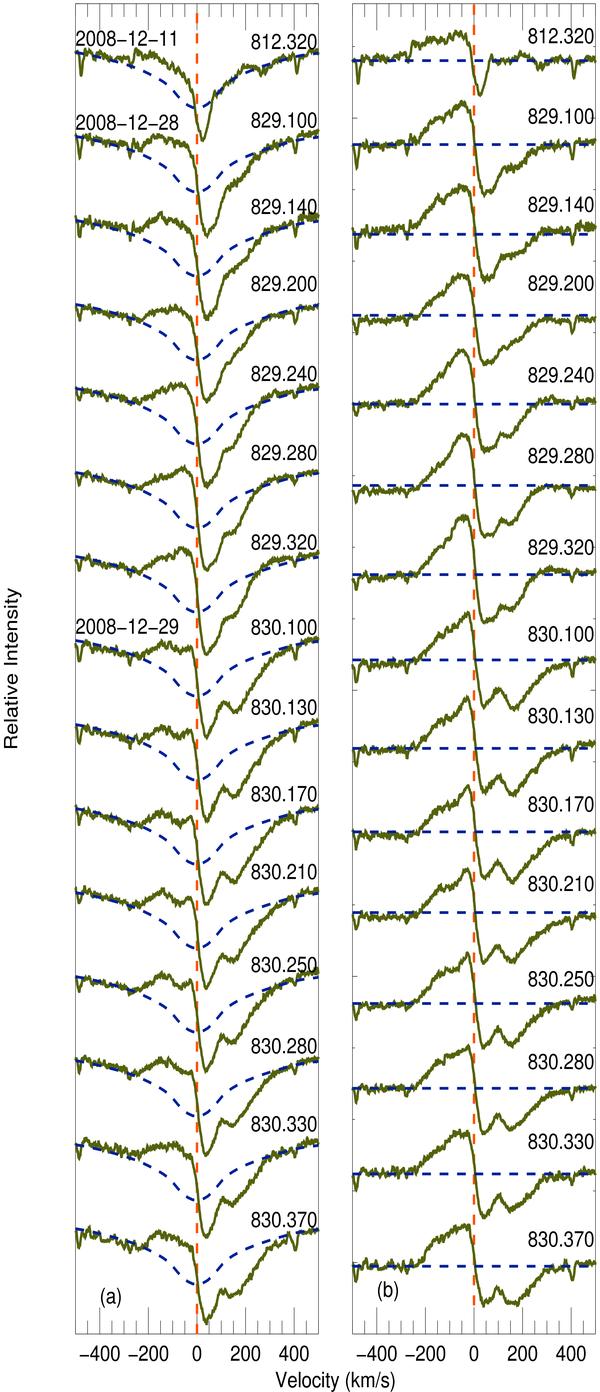
Fig. 4

a) Hα line profiles (green solid lines) of V351 Ori of a few days in December 2008. Synthetic Hα line profiles (blue dashed lines) are overplotted on each spectrum. Modified Julian days are displayed against the respective spectrum. The vertical red dashed line represents the rest frame velocity of the star. b) Residual spectra of Hα line profiles in the same epochs. Horizontal blue dashed lines represent the zero absorption levels. (This figure is available in colour in electronic form.)
Current usage metrics show cumulative count of Article Views (full-text article views including HTML views, PDF and ePub downloads, according to the available data) and Abstracts Views on Vision4Press platform.
Data correspond to usage on the plateform after 2015. The current usage metrics is available 48-96 hours after online publication and is updated daily on week days.
Initial download of the metrics may take a while.


