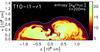
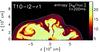
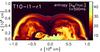
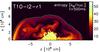
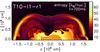
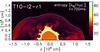
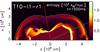
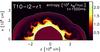
Fig. 1

Entropy distribution in models T10-l1-r1 (left column) and T10-l2-r1 (right column) for different times after bounce as indicated in every panel. The figures are plotted such that the polar axis is oriented horizontally with “south” (θ = π) on the left and “north” (θ = 0) on the right. The thin grey line marks the shock radius. In the panel for t = 1500 ms of model T10-l1-r1, the radial lines mark the angular directions at θ = 25 degrees (green line) and 100 degrees (red line), along which radial profiles are shown in Fig. 6.
Current usage metrics show cumulative count of Article Views (full-text article views including HTML views, PDF and ePub downloads, according to the available data) and Abstracts Views on Vision4Press platform.
Data correspond to usage on the plateform after 2015. The current usage metrics is available 48-96 hours after online publication and is updated daily on week days.
Initial download of the metrics may take a while.