Fig. 4
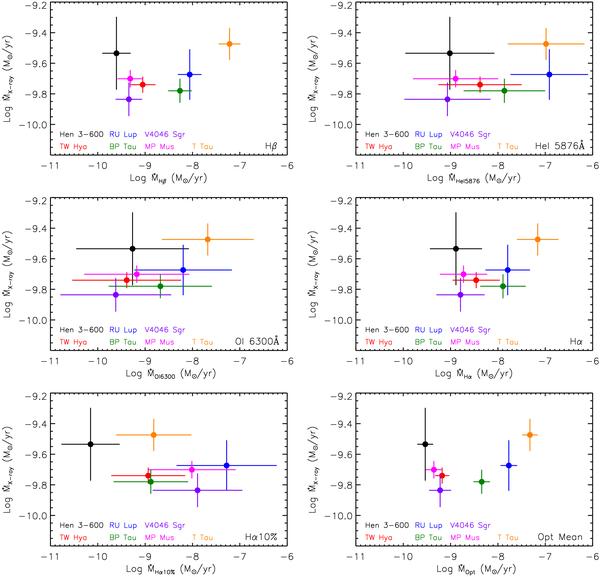
Plots of the optically derived mass-accretion rates versus the X-ray derived mass-accretion rates. Each panel shows the optical accretion rate derived from a different tracer, indicated in the lower right corner of the plot. The CTTSs are colour coded (see lower left corner of each panel). We plot only those cases for which we have measured the mass-accretion rate for all the stars in our sample (see Table 5). The bottom right panel shows a plot of the optical mean mass-accretion rate plotted against the X-ray accretion rate. There is a very small range, a factor ≈2, in X-ray accretion rate calculated for the entire sample, whereas the optical mass-accretion rates span a range of ~3 orders of magnitude.
Current usage metrics show cumulative count of Article Views (full-text article views including HTML views, PDF and ePub downloads, according to the available data) and Abstracts Views on Vision4Press platform.
Data correspond to usage on the plateform after 2015. The current usage metrics is available 48-96 hours after online publication and is updated daily on week days.
Initial download of the metrics may take a while.