Fig. 8
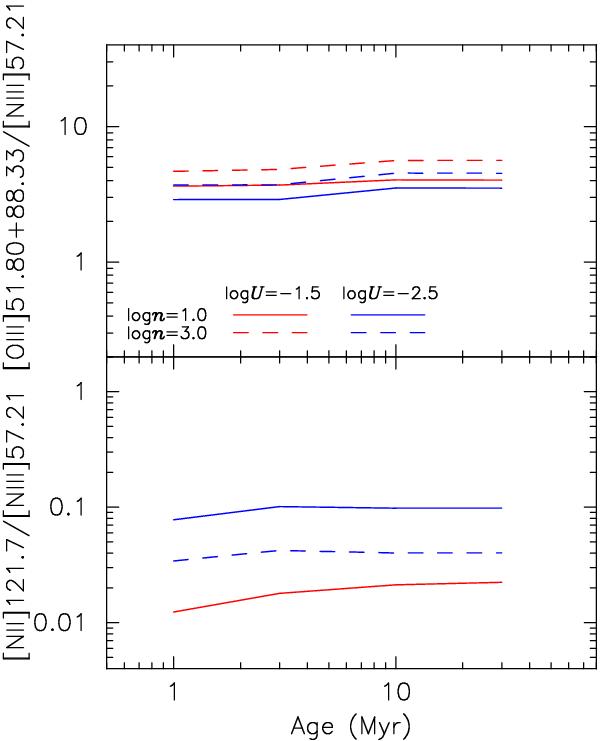
Dependence of the predicted emission-line flux ratios ([Oiii]51.80+[Oiii]88.33)/[Niii]57.21 (upper panel) and [Nii]121.7/ [Niii]57.21 (lower panel) on the age of the stellar population used in the photoionization model calculations. Models with constant star-formation history and with solar metallicity are displayed. The meanings of lines are the same as in Fig. 3. In the lower panel, models with nH = 103 cm-3 and U = 10-1.5 are not plotted, because the flux of the [Nii]121.7 is too faint for those parameters. The displayed ranges of emission-line flux ratios in the upper and lower panels are the same as those in Fig. 5 and the lower panel of Fig. 6, respectively.
Current usage metrics show cumulative count of Article Views (full-text article views including HTML views, PDF and ePub downloads, according to the available data) and Abstracts Views on Vision4Press platform.
Data correspond to usage on the plateform after 2015. The current usage metrics is available 48-96 hours after online publication and is updated daily on week days.
Initial download of the metrics may take a while.