Fig. 7
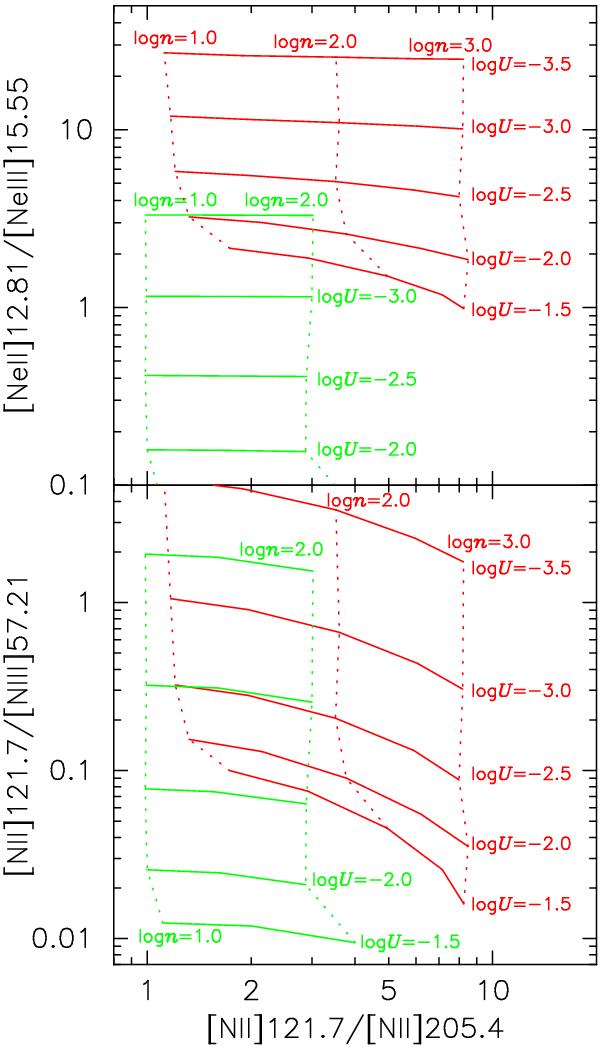
Predicted emission-line flux ratio of [Neii]12.81/[Neiii]15.55 (upper) and [Nii]121.7/[Niii]57.21 (lower) as a function of the density-sensitive flux ratio [Nii]121.7/[Nii]205.4. Solid and dotted lines denote U-constant and nH-constant model sequences, respectively. Models with Zgas = 1.0 Z⊙ and 3.0 Z⊙ are denoted by green and red lines, respectively. Only the models with nH ≤ 102 cm-3 are plotted for Zgas = 1.0 Z⊙, and models with nH ≤ 103 cm-3 are plotted for Zgas = 3.0 Z⊙. This is because the [Nii] lines are faint in clouds with a high density owing to the collisional de-excitation effects.
Current usage metrics show cumulative count of Article Views (full-text article views including HTML views, PDF and ePub downloads, according to the available data) and Abstracts Views on Vision4Press platform.
Data correspond to usage on the plateform after 2015. The current usage metrics is available 48-96 hours after online publication and is updated daily on week days.
Initial download of the metrics may take a while.