Fig. 2
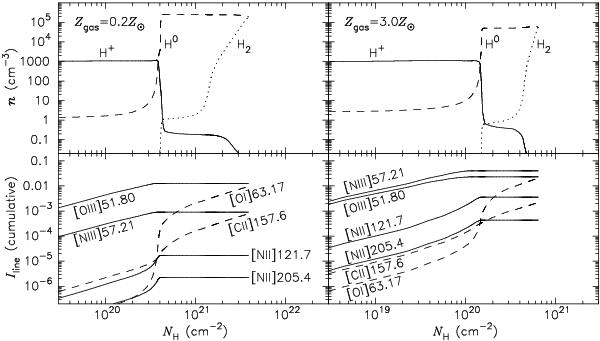
Hydrogen density structure (upper panels) and cumulative intensity of some fine-structure emission lines (lower panels) of clouds with Zgas = 0.2 Z⊙ (left hand panels) and Zgas = 3.0 Z⊙ (right hand panels), as a function of the hydrogen column density. For both cases, nH = 103 cm-3 and U = 10-2.5 are adopted (where nH is the hydrogen density at the illuminated face of clouds). Solid, dashed, and dotted lines in the upper panels denote the densities of H+, H0, and H2, respectively. In the lower panels, solid lines show cumulative intensities for fine-structure emissions mainly from Hii regions, while dashed lines are for emissions that are emitted also, or mostly from PDRs.
Current usage metrics show cumulative count of Article Views (full-text article views including HTML views, PDF and ePub downloads, according to the available data) and Abstracts Views on Vision4Press platform.
Data correspond to usage on the plateform after 2015. The current usage metrics is available 48-96 hours after online publication and is updated daily on week days.
Initial download of the metrics may take a while.