Fig. 1
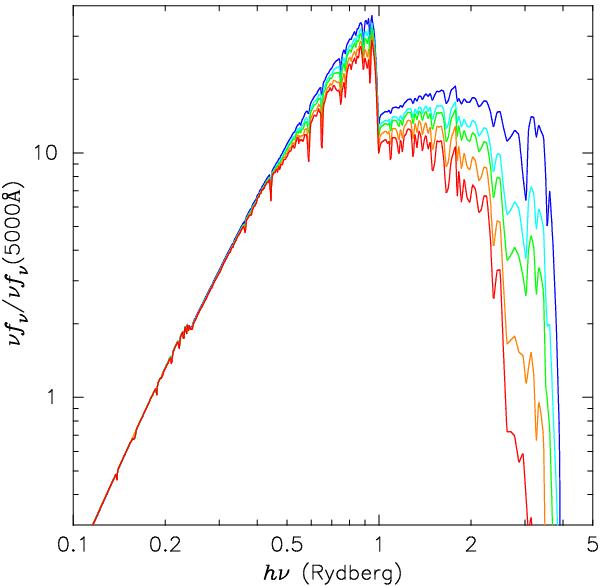
Spectral energy distributions of the ionizing continuum adopted in our photoionization models, which are starburst99 constant star-formation model spectra (Leitherer et al. 1999) with an age of 1 Myr and an α = 2.35 IMF (Mlow = 1 M⊙ and Mup = 100 M⊙). Although most of our analysis adopts these spectra, models with different ages (3, 10, and 30 Myr) are investigated in Sect. 3.3. The blue, cyan, green, orange, and red spectra denote a model with Zstar = 0.05 Z⊙, 0.2 Z⊙, 0.4 Z⊙, 1.0 Z⊙, and 2.0 Z⊙, respectively. The Zstar = 2.0 Z⊙ spectrum is used also for our Zgas = 3.0 Z⊙ calculations (see the main text). All spectra are normalized at 5000 Å (≃ 0.18 Ryd).
Current usage metrics show cumulative count of Article Views (full-text article views including HTML views, PDF and ePub downloads, according to the available data) and Abstracts Views on Vision4Press platform.
Data correspond to usage on the plateform after 2015. The current usage metrics is available 48-96 hours after online publication and is updated daily on week days.
Initial download of the metrics may take a while.