Fig. 6
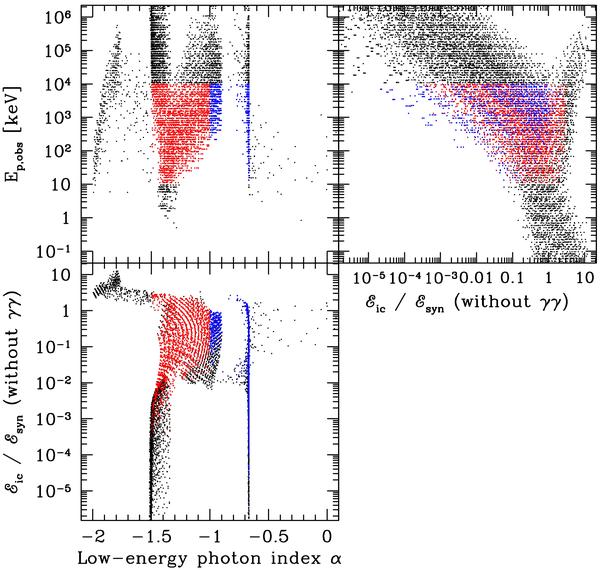
Exploration of the internal shock parameter space (1). All cases fulfilling the conditions of (i) transparency; (ii) radiative efficiency; and (iii) synchrotron dominance at low-energy (see text) are plotted with black dots in three planes: Ep,obs vs. α (top-left panel); ℰic/ℰsyn vs. α (bottom-left panel); Ep,obs vs ℰic/ℰsyn (top-right panel). The ratio ℰic/ℰsyn does not take into account the fraction of high energy photons that are suppressed by γγ annihilation. In addition, the cases where the synchrotron spectrum peaks in the gamma-ray range (10 keV ≤ Ep,obs ≤ 10 MeV) and the low-energy photon index is in the range −3/2 ≤ α ≤ −1 (resp. −1 ≤ α ≤ −2/3) are plotted in red (resp. blue).
Current usage metrics show cumulative count of Article Views (full-text article views including HTML views, PDF and ePub downloads, according to the available data) and Abstracts Views on Vision4Press platform.
Data correspond to usage on the plateform after 2015. The current usage metrics is available 48-96 hours after online publication and is updated daily on week days.
Initial download of the metrics may take a while.