Fig. 1
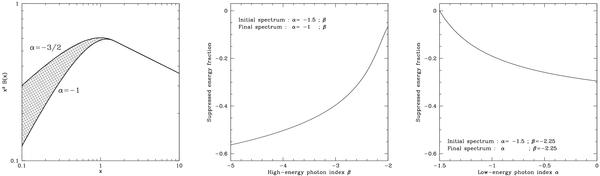
Consequences on energetics of a steepening of the low-energy slope in the “Band” function. Left: the normalized “Band” function is plotted for β = −2.25 and α = −1.5 (standard value for synchrotron radiation in fast cooling regime) or α = −1 (mean value observed in GRB spectra). The dashed area corresponds to the fraction fe of the energy that should be removed by any process leading to such a change of the low-energy photon index. Here fe ≃ 19%. Center: the fraction fe is now plotted as a function of β, assuming a low-energy photon index changing from α = −1.5 to −1. Right: the fraction fe is now plotted as a function of α, when the photon index is changing from α = −1.5 to α. We assume β = −2.25. These three figures are plotted assuming that the process responsible for the change of the slope α does not affect the value of the break energy Eb nor the high-energy tail of the spectrum.
Current usage metrics show cumulative count of Article Views (full-text article views including HTML views, PDF and ePub downloads, according to the available data) and Abstracts Views on Vision4Press platform.
Data correspond to usage on the plateform after 2015. The current usage metrics is available 48-96 hours after online publication and is updated daily on week days.
Initial download of the metrics may take a while.