Fig. 1
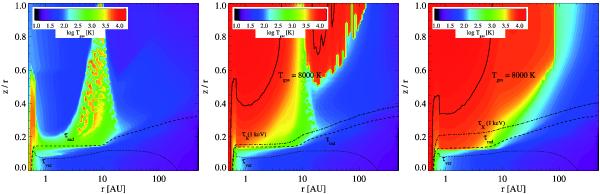
Gas temperature distribution: Model 1 (UV only) in the left panel, X-ray models with LX = 1030 erg s-1 (model 3), LX = 1032 erg s-1 (model 5) in the middle and right panel, respectively. Contour lines are plotted over for τrad = 1 (radial dust optical depth at 550 nm, dashed line), τver = 1 (vertical dust optical depth at 550 nm, dotted line), and an X-ray optical depth of one at 1 keV (dot-dashed line). The relative positions of these two depths depend strongly on the assumed dust properties (see Table 2). The solid line corresponds to Tgas = 8000 K.
Current usage metrics show cumulative count of Article Views (full-text article views including HTML views, PDF and ePub downloads, according to the available data) and Abstracts Views on Vision4Press platform.
Data correspond to usage on the plateform after 2015. The current usage metrics is available 48-96 hours after online publication and is updated daily on week days.
Initial download of the metrics may take a while.