Fig. 7
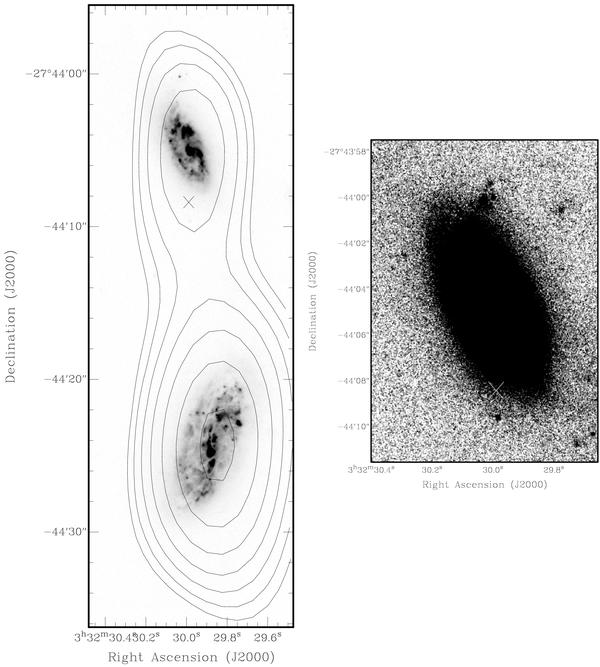
Left panel: HST B-band image of S443 (at the
top) and S442 (bottom). Black contours (starting at
0.1 mJy and increasing by factors of  ) represent the ATCA 1.4 GHz flux
density and the cross indicates the S443 VLBI position. Right
panel: an enlarged region of the HST image of S443 with enhanced
contrast and a cross indicating the VLBI position, which is at the very edge of
the galaxy, but not outside it.
) represent the ATCA 1.4 GHz flux
density and the cross indicates the S443 VLBI position. Right
panel: an enlarged region of the HST image of S443 with enhanced
contrast and a cross indicating the VLBI position, which is at the very edge of
the galaxy, but not outside it.
Current usage metrics show cumulative count of Article Views (full-text article views including HTML views, PDF and ePub downloads, according to the available data) and Abstracts Views on Vision4Press platform.
Data correspond to usage on the plateform after 2015. The current usage metrics is available 48-96 hours after online publication and is updated daily on week days.
Initial download of the metrics may take a while.