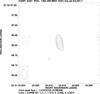
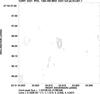
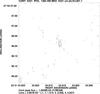
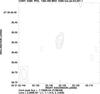
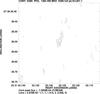
Fig. 3
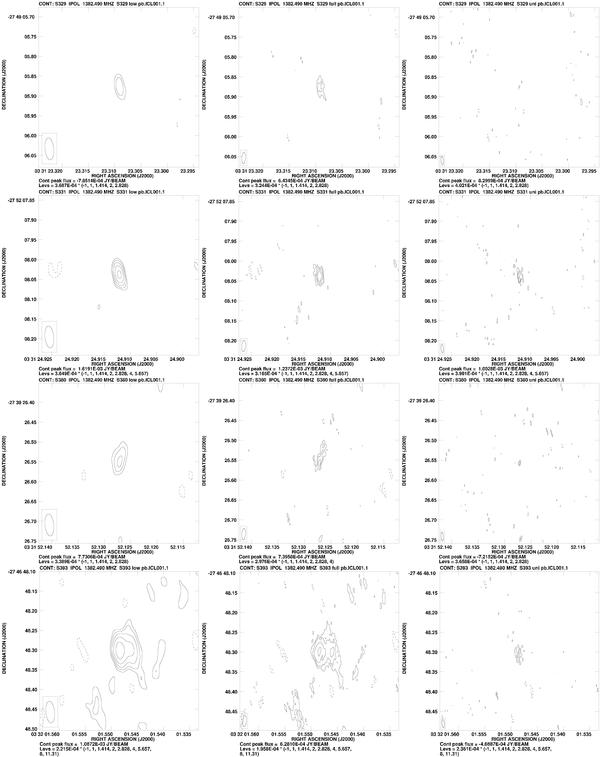
Contour plots of the detected sources. Three images per source are shown in a
row. Left column: naturally-weighted images made with a
10 Mλ tapering (restoring beam size
55.5 × 22.1 mas2); middle column: untapered,
naturally-weighted image (restoring beam size 28.6 × 9.3 mas2);
right column: uniformly-weighted image (restoring beam
20.8 × 5.9 mas2). Positive contours start at three times the rms
level of the images and increase by factors of
 . One negative contour is shown at
three times the rms.
. One negative contour is shown at
three times the rms.
Current usage metrics show cumulative count of Article Views (full-text article views including HTML views, PDF and ePub downloads, according to the available data) and Abstracts Views on Vision4Press platform.
Data correspond to usage on the plateform after 2015. The current usage metrics is available 48-96 hours after online publication and is updated daily on week days.
Initial download of the metrics may take a while.