Fig. 2
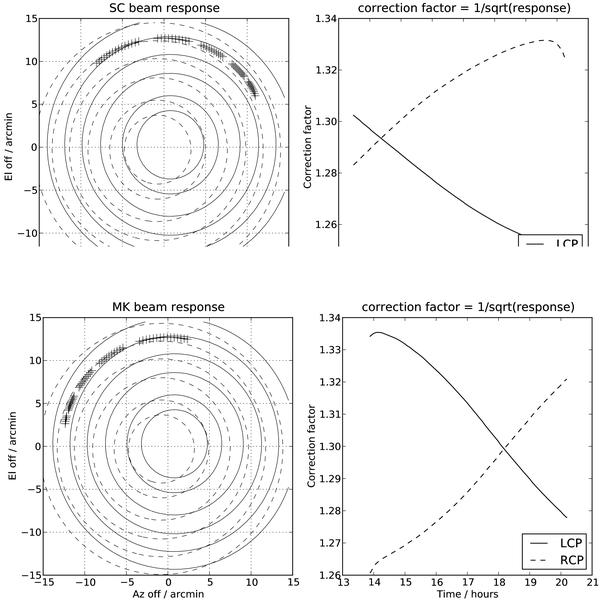
Top left: contour plot illustrating the relative orientation of the LCP (solid lines) and RCP (dashed lines) response of the VLBA antenna at Saint Croix. Contours are drawn at 95%, 90%, 80%, ..., 50% of the peak response. The series of crosses indicates the location of S462 in the antenna’s primary beam during the observations, in intervals of approximately 6 min. Top right: the correction factor required to compensate for primary beam attenuation according to the location of the target, plotted as a function of observing time. The corrections for LCP and RCP can be quite different. Bottom left and right: the same plots for the Mauna Kea station. The series of crosses shows that the correction factors are markedly different from those at Saint Croix, because of the different parallactic angle.
Current usage metrics show cumulative count of Article Views (full-text article views including HTML views, PDF and ePub downloads, according to the available data) and Abstracts Views on Vision4Press platform.
Data correspond to usage on the plateform after 2015. The current usage metrics is available 48-96 hours after online publication and is updated daily on week days.
Initial download of the metrics may take a while.