Fig. 1
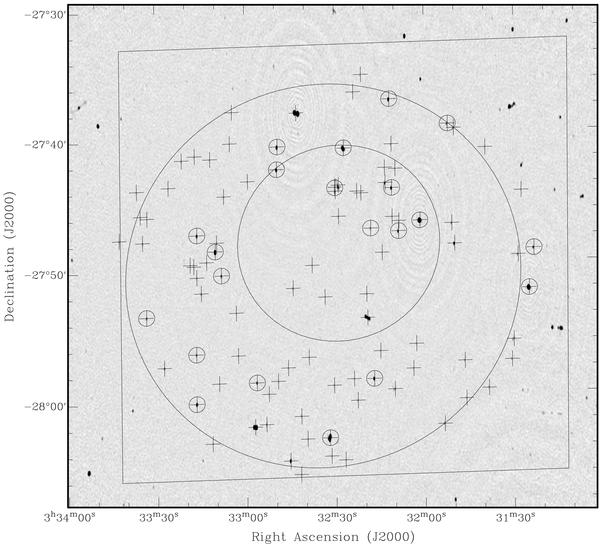
An overview of the observed area. The background image is a radio image of the CDFS made with the Australia Telescope Compact Array (Norris et al. 2006). The rms of the image is around 20 μJy beam-1, and the faintest sources have flux densities of 100 μJy. The square indicates the ECDFS area observed with the Chandra satellite by Lehmer et al. (2005) with an integration time of 240 ks; the large circle indicates a typical VLBA antenna’s primary beam size at the half-power level at 1.4 GHz; and the medium circle is the region covered uniformly with a 2 Ms exposure with Chandra by Luo et al. (2008) (centred on the average aim point with a radius of 7.5′, see their Fig. 2). Crosses are drawn at the locations of the 96 targets taken from Norris et al. (2006) and small circles indicate those targets which were detected with the VLBA.
Current usage metrics show cumulative count of Article Views (full-text article views including HTML views, PDF and ePub downloads, according to the available data) and Abstracts Views on Vision4Press platform.
Data correspond to usage on the plateform after 2015. The current usage metrics is available 48-96 hours after online publication and is updated daily on week days.
Initial download of the metrics may take a while.