Fig. 7
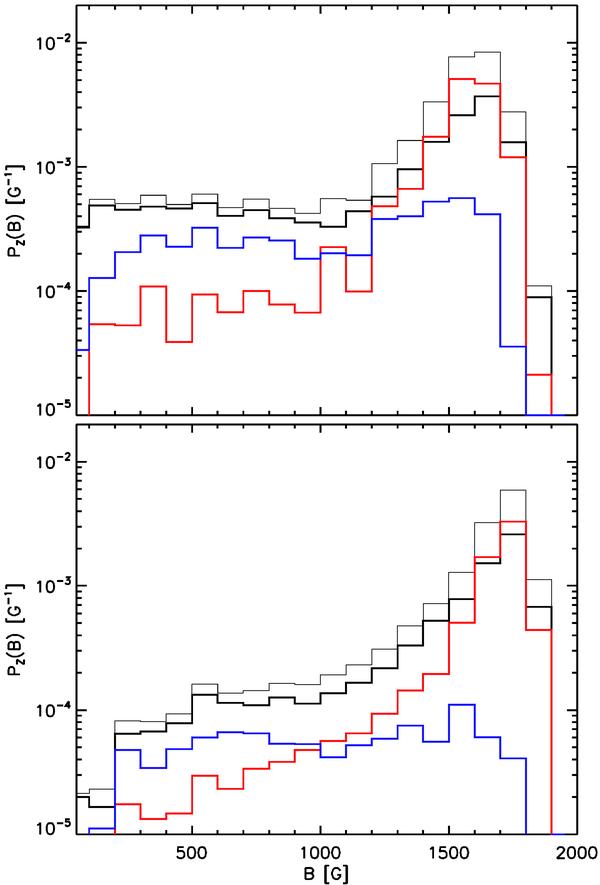
Fraction of analyzed photosphere covered by a given strength. Field strength distributions for the major component (upper panel): IN (black thick line), network (red line), mixed polarity regions (blue line), and the full 29.52″ × 31.70″ subfield (black thin line). Field strength distributions for the minor component (lower panel).
Current usage metrics show cumulative count of Article Views (full-text article views including HTML views, PDF and ePub downloads, according to the available data) and Abstracts Views on Vision4Press platform.
Data correspond to usage on the plateform after 2015. The current usage metrics is available 48-96 hours after online publication and is updated daily on week days.
Initial download of the metrics may take a while.