Fig. 6
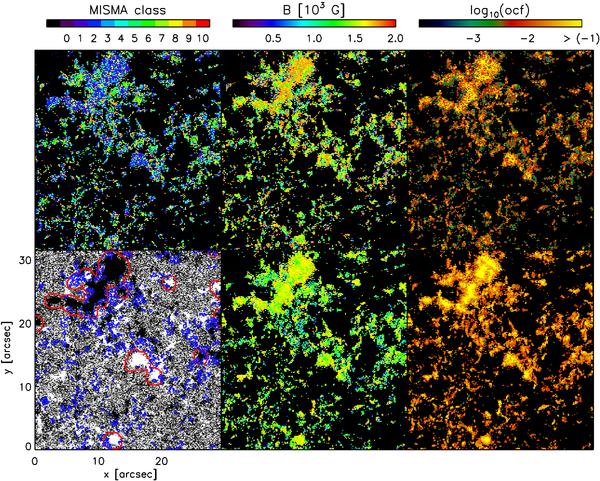
Results of the inversion at the constant reference height, corresponding to the base of the photosphere. The different panels contain: classes of initial model MISMAs used in the inversion (upper-left panel), field strength for the minor component (upper-central panel), and occupation fraction for the minor component (upper-right panel), COG magnetogram saturated at ± 50 G (lower-left panel), field strength for the major component (lower-central panel), occupation fraction of the major component (lower-right panel). The contours in the COG magnetogram represent the network regions identified by our automatic procedure (red), and the pixels with mixed polarities in the resolution element (blue). Black pixels in the MISMA class, field strength, and occupation fraction maps correspond to regions that are not inverted (see Fig. 2). The bars at the top represent the color palettes adopted for the MISMA initial models (on the left), and for the two pairs of images of field strength (at the center) and occupation fraction (on the right).
Current usage metrics show cumulative count of Article Views (full-text article views including HTML views, PDF and ePub downloads, according to the available data) and Abstracts Views on Vision4Press platform.
Data correspond to usage on the plateform after 2015. The current usage metrics is available 48-96 hours after online publication and is updated daily on week days.
Initial download of the metrics may take a while.