Fig. 3
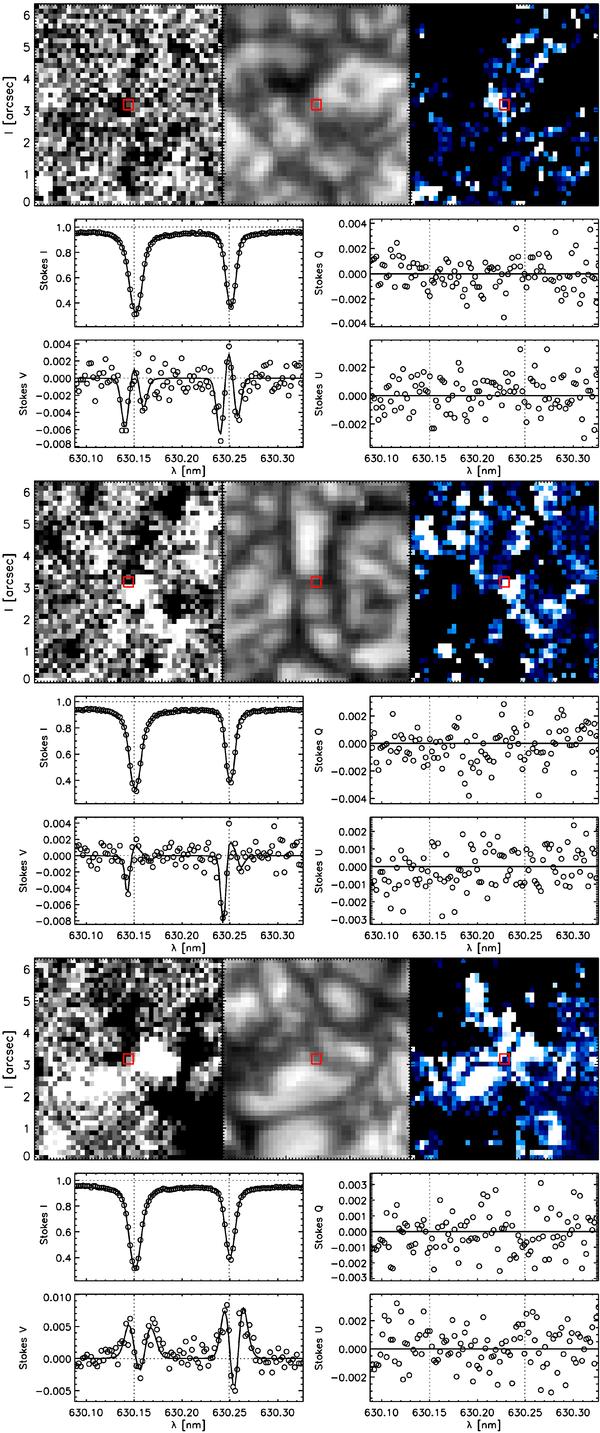
Examples of MISMA inversion of HINODE SOT/SP Stokes profiles corresponding to mixed polarities in the resolution element. We show profiles in three different pixels representative of a weakly polarized IN region (upper panels), frontier pixels between regions with opposite polarity in the IN (central panels) and network (lower panels). The results are organized in two sets of panels; each of these sets contains an upper row with images that place the pixel in context, and a lower row with the four Stokes profiles (as labeled). The upper row shows l × l (l ≃ 6′′) maps of the COG magnetogram saturated at ±50 G (left), the continuum intensity (central), and the net-circular polarization saturated at 0.3 (right). The red square indicates the position from which the profiles are taken. Lower rows: observed Stokes profiles (symbols) and best-fit Stokes profiles (solid lines). The vertical dotted lines indicate the laboratory wavelengths of the two lines.
Current usage metrics show cumulative count of Article Views (full-text article views including HTML views, PDF and ePub downloads, according to the available data) and Abstracts Views on Vision4Press platform.
Data correspond to usage on the plateform after 2015. The current usage metrics is available 48-96 hours after online publication and is updated daily on week days.
Initial download of the metrics may take a while.