Fig. 2
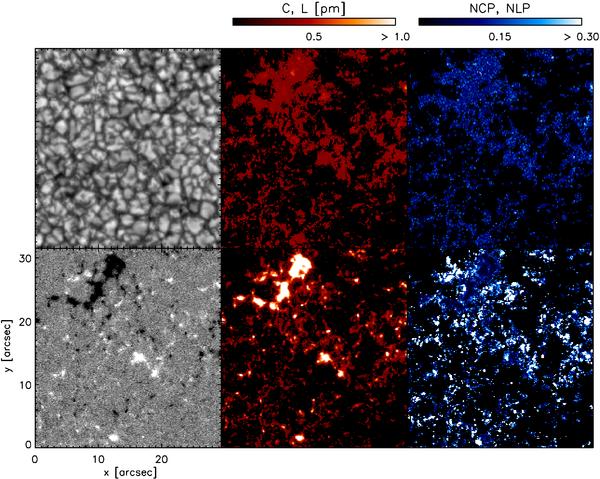
Main observational properties of the representative 29.52″ × 31.70″ subfield selected for in-depth analysis. Continuum intensity (upper-left panel), total linear polarization (L, upper-central panel), net-linear polarization (NLP, upper-right panel), COG magnetogram saturated at ± 200 G (lower-left panel), total circular polarization (C, lower-central panel), and net-circular polarization (NCP, lower-right panel). The total polarization maps are both saturated at 1 pm, while the net-circular and net-linear polarization maps are saturated at 0.3. Black pixels in L, C, NLP, and NCP maps represent regions with signals below the threshold for inversion. The bars on top represent the color palettes adopted for the two pairs of images below them.
Current usage metrics show cumulative count of Article Views (full-text article views including HTML views, PDF and ePub downloads, according to the available data) and Abstracts Views on Vision4Press platform.
Data correspond to usage on the plateform after 2015. The current usage metrics is available 48-96 hours after online publication and is updated daily on week days.
Initial download of the metrics may take a while.