Fig. 1
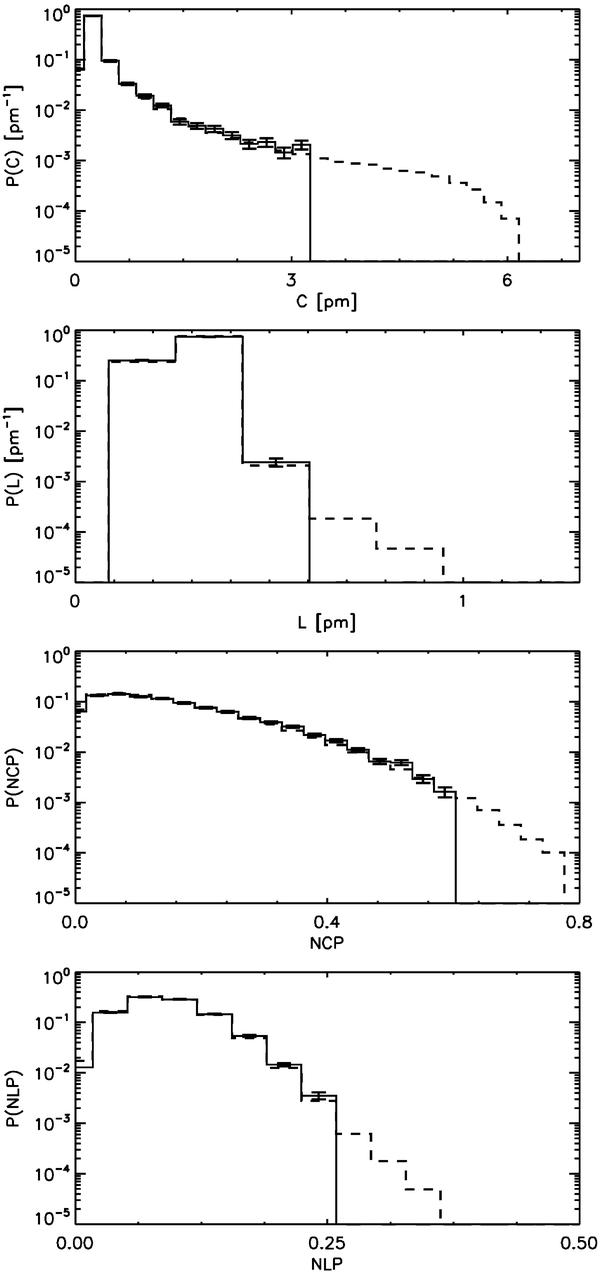
Comparison between the statistical properties of the full 302″ × 162″ FOV (dashed line) and the statistical properties of the selected 29.52″ × 31.70″ subfield (solid line). From top to bottom: histogram of total circular polarization (C, first plot), total linear polarization (L, second plot), net-circular polarization (NCP, third plot), and net-linear polarization (NLP, fourth plot). The error bars are defined as the square root of the number of counts in each bin.
Current usage metrics show cumulative count of Article Views (full-text article views including HTML views, PDF and ePub downloads, according to the available data) and Abstracts Views on Vision4Press platform.
Data correspond to usage on the plateform after 2015. The current usage metrics is available 48-96 hours after online publication and is updated daily on week days.
Initial download of the metrics may take a while.