| Issue |
A&A
Volume 526, February 2011
|
|
|---|---|---|
| Article Number | A36 | |
| Number of page(s) | 8 | |
| Section | Extragalactic astronomy | |
| DOI | https://doi.org/10.1051/0004-6361/201015358 | |
| Published online | 17 December 2010 | |
The X-ray spectral signatures from the complex circumnuclear regions in the Compton thick AGN NGC 424
1
Dipartimento di FisicaUniversità degli Studi Roma Tre,
via della Vasca Navale 84,
00146
Roma,
Italy
e-mail: marinucci@fis.uniroma3.it
2
Institute of Astronomy, Madingley Road, Cambridge
CB3 0HA,
UK
3
ICREA Research Professor at Institut de Ciències del Cosmos,
Universitat de Barcelona, Martí i
Franquès, 1, 08028
Barcelona,
Spain
4
Centro de Astrobiología (CSIC–INTA), Dep. de Astrofísica;
LAEFF, PO Box 78,
28691, Villanueva de la Cañada, Madrid,
Spain
5
Osservatorio Astronomico di Roma (INAF),
Via Frascati 33, 00040
Monte Porzio Catone,
Italy
Received:
7
July
2010
Accepted:
11
October
2010
Aims. Most of our knowledge of the circumnuclear matter in Seyfert galaxies is based on the X-ray spectra of the brightest Compton-thick Seyfert 2 galaxies. The complete obscuration of the nuclear radiation in these sources allows us to study all the components arising from reprocessing of the primary continuum in the circumnuclear matter in detail, while they are heavily diluted in unobscured sources, often down to invisibility.
Methods. We present the XMM-Newton RGS and EPIC pn spectra of a long (≃100 ks) observation of one of the soft X-ray brightest Compton-thick Seyfert 2 galaxies, NGC 424. As a first step, we performed a phenomenological analysis of the data to derive the properties of all the spectral components. On the basis of these results, we fitted the spectra with self-consistent photoionisation models, produced with cloudy.
Results. The high-energy part of the spectrum is dominated by a pure neutral Compton reflection component and a neutral iron Kα line, together with Kα emission from neutral Ni, suggesting a significant Ni/Fe overabundance. The soft X-ray RGS spectrum comes mostly from line emission from H-like and He-like C, N, O, and Ne, as well as from the Fe L-shell. The presence of narrow RRC from O viii, O vii, and C vi, the last two with resolved widths corresponding to temperatures around 5–10 eV, is a strong indication of a gas in photoionisation equilibrium, as confirmed by the prevalence of the forbidden component in the O vii triplet. Two gas phases with different ionisation parameters are needed to reproduce the spectrum with a self-consistent photoionisation model, any contribution from a gas in collisional equilibrium being no more than 10% of the total flux in the 0.35–1.55 keV band. When this self-consistent model is applied to the 0.5–10 keV band of the EPIC pn spectrum, a third photoionised phase is needed to account for emission lines with higher ionisation potential, although Kα emission from S xv and Fe xxvi remains under-predicted.
Key words: galaxies: active / galaxies: Seyfert / galaxies: nuclei / X-rays: galaxies
© ESO, 2010
1. Introduction
The X-ray spectrum of Compton-thick Seyfert 2 galaxies is dominated by reflection components, from both cold and ionised circumnuclear matter (e.g. Matt 2000). The complete obscuration of the nuclear radiation, at least up to 10 keV, permits a clear view of these components that are heavily diluted in unobscured sources, often down to invisibility. Most of our knowledge of the circumnuclear matter, at least as far as their X-ray properties are concerned, is based on the brightest Compton-thick sources, like Circinus (e.g. Matt et al. 1999; Sambruna et al. 2001; Molendi et al. 2003), NGC 1068 (e.g. Kinkhabwala et al. 2002; Matt et al. 2004) and Mrk 3 (e.g. Sako et al. 2000; Bianchi et al. 2005; Pounds & Page 2005).
NGC 424 (a.k.a. Tololo 0109-383, z = 0.0117) is one of the brightest Compton-thick Seyfert galaxies (e.g. Matt et al. 2000). Broad Hα and Hβ lines were observed in polarised light (e.g. Moran et al. 2000), where the polarisation degree is about 4% after correction for starlight. Fe ii emission and an extended (about 1 kpc) high ionisation nuclear emission line region (HINER), 70% of which was however unresolved (<200 pc) have been discovered (Murayama et al. 1998). HST/WFPC2 data showed the presence of a dust lane across the central part of the galaxy (Malkan et al. 1998), which may help explain the observed AV ~ 1.4 to the NLR (Murayama et al. 1998). The IRAS colours are quite warm, suggesting that the IR emission is dominated by dust reprocessing of the nuclear radiation (e.g. Matt et al. 2000).
In X-rays, the ASCA spectrum shows a prominent iron line, a flat spectrum, and a high [O iii]/F(2–10 keV) ratio, suggesting that the nucleus of NGC 424 should be absorbed by Compton-thick matter (Collinge & Brandt 2000). This result has been fully confirmed by the BeppoSAX observation (Matt et al. 2000; Iwasawa et al. 2001), which measured an absorbing column of about 2 × 1024 cm-2, for an estimated nuclear 2–10 keV luminosity of about 1043 erg s-1. NGC 424 was then observed by Chandra and XMM-Newton (Matt et al. 2003). Both observations were rather short (less than 10 ks each), but good enough to derive a few interesting properties of the source. The nuclear radiation was found to be reflected by both cold material (probably the inner wall of the torus) giving rise to the Compton reflection component and the iron Kα fluorescent line, and by ionised matter, responsible for the soft X-ray emission. All these components are seen through a dust lane, responsible for the Balmer decrement and the absorption of the soft X-ray emission. Extended emission features in the Chandra observation are discussed in Matt et al. (2003). We present here a new, long (~100 ks) XMM-Newton observation of NGC 424, to investigate the properties of its circumnuclear regions in greater detail.
2. Observations and data reduction
The XMM-Newton observation analysed in this paper was performed on 2008 December 7 (obsid 0550950101), with the EPIC CCD cameras, the pn (Strüder et al. 2001) and two MOS (Turner et al. 2001), operated in large window and medium filter, and the RGS cameras. Source extraction radii and screening for intervals of flaring particle background were performed with SAS 10.0.0 (Gabriel et al. 2004) via an iterative process which leads to a maximization of the Signal-to-Noise Ratio (SNR), similarly to that described in Piconcelli et al. (2004). After this process, the net exposure time was of about 104 ks for the pn, adopting an extraction radius of 31 arcsec and patterns 0 to 4. The background spectrum was extracted from source-free circular regions with a radius of 50 arcsec. Spectra were binned in order to over-sample the instrumental resolution by at least a factor of 3 and to have no less than 30 counts in each background-subtracted spectral channel. This allows the applicability of the χ2 statistics.
The RGS spectra were reduced following the guidelines in Guainazzi & Bianchi (2007). Data reduction pipeline rgsproc was used, coupled with the latest calibration files available. We choose a fixed celestial reference point for the attitude solution, coincident with the NED optical nucleus of NGC 424. Source spectra were extracted in regions of the dispersion versus cross-dispersion and Pulse Invariant versus cross-dispersion planes, corresponding to 95% of the Point Spread Function (PSF) in the cross-dispersion direction. Background spectra have been generated using a sub-set of blank field observations, whose background counts matches the level measured during each individual RGS observation. The final net exposure times are about 123 ks for RGS1 and RGS2.
3. Data analysis
The adopted cosmological parameters are H0 = 70 km s-1 Mpc-1, ΩΛ = 0.73 and Ωm = 0.27 (i.e. the default ones in xspec 12.5.1: Arnaud 1996). Errors correspond to the 90% confidence level for one interesting parameter (Δχ2 = 2.7), if not otherwise stated. The RGS spectra were not re-binned and were analysed using the Cash-statistics (Cash 1976).
3.1. RGS: phenomenological spectral analysis
The soft X-ray spectrum of NGC 424 appears dominated by line emission, as commonly found
in this class of sources (e.g. Guainazzi & Bianchi
2007). As a first step, we performed phenomenological fits on ≃100-bin spectral
segments, using Gaussian profiles at the redshift of the source
(z = 0.0117), and a power law, both absorbed by the Galactic column
density along the line of sight
(NH = 1.8 × 1020 cm-2: Dickey & Lockman 1990). Since the model used to fit
the continuum is not very sensitive to the photon index Γ, due to the very limited band
width of each segment, it has been fixed to 1. Emission lines from H-like and He-like C,
N, O, and Ne, as well as from the Fe L-shell, are all clearly detected (see Table 1). The spectrum also presents radiative recombination
continua (RRC) from O vii, O viii and C vi. These features were
fitted with the REDGE model in XSPEC. The width of the O vii RRC and C vi
RRC are slightly resolved, allowing us to infer an electron temperature of
 eV for the former and
 eV for the latter. The same value inferred
from the O vii RRC was adopted for the O viii RRC, because it could not
be significantly constrained in the fit. All the observed transition energies are
consistent with the theoretical values, but there is an hint of a systemic blueshift in
some of the strongest emission lines (e.g. C vi Kα and the
forbidden component of the O vii triplet). On the other hand, no emission line is
resolved, the tightest upper limits being those of the forbidden components of N vi
and O vii Kα (σ < 220 and
270 km s-1).
eV for the latter. The same value inferred
from the O vii RRC was adopted for the O viii RRC, because it could not
be significantly constrained in the fit. All the observed transition energies are
consistent with the theoretical values, but there is an hint of a systemic blueshift in
some of the strongest emission lines (e.g. C vi Kα and the
forbidden component of the O vii triplet). On the other hand, no emission line is
resolved, the tightest upper limits being those of the forbidden components of N vi
and O vii Kα (σ < 220 and
270 km s-1).
Detected emission lines in the XMM-Newton RGS spectra of NGC 424.
The analysis of the O vii triplet may provide precious information to determine
whether the plasma is in photoionisation or collisional equilibrium. The three lines of
the triplet are transitions between the n = 2 shell and the
n = 1 ground-state shell, i.e.: the resonance line
r, corresponding to a  transition, the intercombination
line i (actually a doublet:
transition, the intercombination
line i (actually a doublet:
 ) and the forbidden line
f (
) and the forbidden line
f ( ). The ratio:
 (1)is a good indicator of the predominant
ionisation process. A weak resonance line compared to the forbidden or the
intercombination lines is typical of plasmas dominated by photoionisation
(G > 4). On the contrary, a strong resonance line is produced in
collision-dominated plasmas, where G ~ 1 (e.g. Porquet & Dubau 2000). In the case of NGC 424, we can clearly infer
that the gas is in photoionisation equilibrium, since G ≳ 4.3 (see
Table 1 and Fig. 1).
(1)is a good indicator of the predominant
ionisation process. A weak resonance line compared to the forbidden or the
intercombination lines is typical of plasmas dominated by photoionisation
(G > 4). On the contrary, a strong resonance line is produced in
collision-dominated plasmas, where G ~ 1 (e.g. Porquet & Dubau 2000). In the case of NGC 424, we can clearly infer
that the gas is in photoionisation equilibrium, since G ≳ 4.3 (see
Table 1 and Fig. 1).
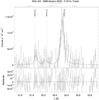 |
Fig. 1 RGS1 spectrum and best fit model for the phenomenological analysis: the O vii triplet. The three transitions are labelled. |
The presence of sharp O vii, O viii and C vi RRC also provide
evidence in favour of photoionisation equilibrium. Radiative recombination is the capture
of a free electron, together with the emission of a photon with energy:
 (2)where E is the initial
energy of the electron, and χn is the
ionisation potential of the level into which the electron is captured. In the case of
collisional ionisation equilibrium the ionisation potential
χn is comparable to the initial energy of
the electron E ≃ kT. As a result, the recombination
radiation is broad, with a width of ~kT. In the case of
photoionisation, typically
kT ≪ χn, and the
recombination radiation is narrow. When observing this effect with the RGS on board
XMM-Newton, the RRC in case of hot gas in collisional equilibrium is too broad to be
visible. The presence of a narrow RRC is, therefore, a strong indicator of
photoionisation.
(2)where E is the initial
energy of the electron, and χn is the
ionisation potential of the level into which the electron is captured. In the case of
collisional ionisation equilibrium the ionisation potential
χn is comparable to the initial energy of
the electron E ≃ kT. As a result, the recombination
radiation is broad, with a width of ~kT. In the case of
photoionisation, typically
kT ≪ χn, and the
recombination radiation is narrow. When observing this effect with the RGS on board
XMM-Newton, the RRC in case of hot gas in collisional equilibrium is too broad to be
visible. The presence of a narrow RRC is, therefore, a strong indicator of
photoionisation.
The O vii RRC (0.7393 keV) may be contaminated by the 3 F component of the
Fe xvii L emission line at 0.7390 keV, since the instrument resolution does not
allow us to discriminate them. Indeed, we detect an emission line at ~0.7263 keV,
which can be securely identified as a blend of the 3G and M2 components of the same
species, Fe xvii. As already discussed in Bianchi
et al. (2010), simulations with the APEC model in XSPEC showed that the ratio:
 (3)for a wide range of temperatures. In our case
the observed ratio between the line detected around 0.739 keV and that at 0.7263 keV is
much higher, being
(3)for a wide range of temperatures. In our case
the observed ratio between the line detected around 0.739 keV and that at 0.7263 keV is
much higher, being  . We can therefore infer that most of the
flux observed at 0.739 keV is due to the O vii RRC component.
. We can therefore infer that most of the
flux observed at 0.739 keV is due to the O vii RRC component.
3.2. RGS: CLOUDY self-consistent model
The high quality of the RGS spectrum, coupled with the results from the phenomenological spectral analysis, encouraged us to build a self-consistent model able to reproduce the whole spectrum, in a wavelength range from 8 Å up to 35 Å. We produced a grid model for xspec using cloudy 08.00 (last described by Ferland et al. 1998). It is an extension of the same model used in Bianchi et al. (2010). The main ingredients are: plane parallel geometry, with the flux of photons striking the illuminated face of the cloud given in terms of ionisation parameter U (Osterbrock & Ferland 2006); incident continuum modelled as in Korista et al. (1997)1; constant electron density ne = 105 cm-3; elemental abundances as in Table 9 of cloudy documentation2; grid parameters are log U = [−2.00:4.00] , step 0.25, and log NH = [19.0:23.5] , step 0.1. Only the reflected spectrum, arising from the illuminated face of the cloud, has been taken into account in our model. We also produced tables with different densities (ne = 103−104 cm-3): all the fits presented in this paper resulted insensitive to this parameter, as expected since we are always treating density regimes where line ratios of He-like triplets are insensitive to density (Porquet & Dubau 2000).
At first, we tried to fit the 8 Å−35 Å spectrum using a single photoionised phase.
The obtained fit is rather good, with most of the lines detected, and with a
Cash/d.o.f. = 4885/4500. The best fit ionisation parameter is
 , with a column density
 . Even if the fit was acceptable, we added
another photoionised phase, to improve the residuals, for a final
Cash/d.o.f. = 4865/4497. The photoionisation parameters for this best fit are
. Even if the fit was acceptable, we added
another photoionised phase, to improve the residuals, for a final
Cash/d.o.f. = 4865/4497. The photoionisation parameters for this best fit are
 and
and
 , while the column densities values are
 and
and
 . These values agree with similar studies
performed on other Seyfert 2 objects (e.g. Kinkhabwala
et al. 2002; Schurch et al. 2004; Bianchi et al. 2010). The total flux in the
0.35−1.55 keV band is
. These values agree with similar studies
performed on other Seyfert 2 objects (e.g. Kinkhabwala
et al. 2002; Schurch et al. 2004; Bianchi et al. 2010). The total flux in the
0.35−1.55 keV band is  erg cm
 s
s , almost equally distributed between the
two photoionised phases. A systemic blueshift of
, almost equally distributed between the
two photoionised phases. A systemic blueshift of  km s-1 is required by the fit,
confirming the results found in the previous section. No significant improvement is
obtained if different systemic velocities are considered for each of the photoionised
phases. Similar velocity blueshifts have been measured in the RGS spectrum of NGC 1068, as
discussed in Kinkhabwala et al. (2002).
km s-1 is required by the fit,
confirming the results found in the previous section. No significant improvement is
obtained if different systemic velocities are considered for each of the photoionised
phases. Similar velocity blueshifts have been measured in the RGS spectrum of NGC 1068, as
discussed in Kinkhabwala et al. (2002).
We tried to convolve our best fit model with a Gaussian smoothing (model gsmooth
in xspec), to check if the emission lines are affected by a systemic
broadening, and we get  km s-1, for a
Cash/d.o.f. = 4858/4496. This result agrees with the RGS phenomenological analysis, even
if no emission line is individually resolved (see previous section). No significant
improvement is obtained if we assume a different broadening for each of the photoionised
phases.
km s-1, for a
Cash/d.o.f. = 4858/4496. This result agrees with the RGS phenomenological analysis, even
if no emission line is individually resolved (see previous section). No significant
improvement is obtained if we assume a different broadening for each of the photoionised
phases.
The phenomenological analysis agrees with the self-consistent model fits, and the
inferred fluxes of all the emission lines reproduced by the CLOUDY model are shown in
Table 1. The two different components of the
self-consistent model give different contributions to the whole spectrum. We can see in
Table 1 how the main contribution to the
O vii Kα line fluxes arises from the component with lower
photoionisation parameter. However, in the case of Ne x Kα, the
predicted flux falls short the observed one. We tried to introduce a further photoionised
phase with a higher photoionisation parameter, but the fit is not sensitive to the new
component and residuals due to Ne x Kα line are still present.
At almost the same energy, an emission line from Fe xvii is expected to be strong
in collisionally ionised plasma. Since other Fe xvii lines are indeed detected in
the spectrum, and their fluxes are all underestimated by our model, we tried to introduce
a collisional component. The Cash/d.o.f. is = 4854/4494 and the
resulting kT is  keV. The Fe xvii lines are
marginally fitted, and the 0.35–1.55 keV flux due to the collisional phase is less than
the 10% of the total flux. We conclude that there is no strong evidence for a collisional
component in our spectrum.
keV. The Fe xvii lines are
marginally fitted, and the 0.35–1.55 keV flux due to the collisional phase is less than
the 10% of the total flux. We conclude that there is no strong evidence for a collisional
component in our spectrum.
It is also interesting to note the underprediction by the model of the O vii Kβ line and of the components of the N vi and O vii Kα triplets, suggesting that the resonant lines are saturated. These inconsistencies could be due to the absence of turbulence velocities in our model. It was shown that the optical depths to resonant absorption can be more than 10 times lower when the gas is affected by strong turbulence (greater than 300 km s-1: Nicastro et al. 1999). This effect would prevent the resonant lines to saturate up to higher column densities than in a gas not affected by turbulence, as assumed in our simple model.
Apart for these lines, the residuals of the model with two photoionised phases are rather
good, with the exception represented by some positive residuals around 13 and 33 Å (see
Fig. 2). Since the latter are significant only in
the RGS1 spectrum we performed a separate analysis between the RGS spectra. It leads to a
line detection only in the RGS1 spectrum ( ph cm-2 s-1 at
 keV), while in the RGS2 only an upper
limit is obtained when the line energy is fixed at 0.3803 keV
(<0.6 × 10⁻⁵ ph cm-2 s-1). The same approach has
been used to treat the residuals around 13 Å, we found in the RGS2 spectrum a line at
keV), while in the RGS2 only an upper
limit is obtained when the line energy is fixed at 0.3803 keV
(<0.6 × 10⁻⁵ ph cm-2 s-1). The same approach has
been used to treat the residuals around 13 Å, we found in the RGS2 spectrum a line at
 keV with a relative
 ph cm-2 s-1 flux.
The latter result is fully consistent with a defective pixel in the RGS2 camera while
since the identification of the former emission line would also be problematic, we
conclude that the two previous detections are insecure3.
ph cm-2 s-1 flux.
The latter result is fully consistent with a defective pixel in the RGS2 camera while
since the identification of the former emission line would also be problematic, we
conclude that the two previous detections are insecure3.
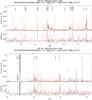 |
Fig. 2 RGS1 (black) and RGS2 (red) self-consistent best fit (see text for detail). The 8–20 Å spectrum is shown in top panel, the 20–35 Å one in bottom panel. |
3.3. EPIC pn spectral analysis
3.3.1. 5–10 keV phenomenological spectral analysis
Prominent emission lines can be clearly observed in the hard part of the spectrum (5–10 keV). Following Iwasawa et al. (2001) and Matt et al. (2003), it has been fitted with a model composed of a strongly absorbed (≃1024 cm-2) power-law with Γ = 2, a pure cold reflection component (model pexrav in xspec, with the cosine of the inclination angle fixed to 0.45), and as many emission lines as required, all of them described by Gaussian profiles. The strongest detected emission line is the neutral Fe Kα at 6.400 keV4, accompanied by a much fainter Fe Kβ at 7.058 keV. Kα emission from neutral Ni at 7.472 keV and Fe xxvi at 6.966 keV are also detected, while only upper limits are found for the main components of the Fe xxv Kα triplet (see Table 2).
While all other lines are unresolved, the neutral Fe Kα line width is σ = 81 ± 12 eV. Before discussing the physical meaning of this width, we investigated any possible instrumental effects. We analysed the calibration observations performed before and after our observation (obsid 0412990601 and 0510780201), and modelled the data with a power-law (Γ = 1, any other choice does not affect the results) and three Gaussian lines, for the Mn Kα doublet (the separation of the lines fixed to be 0.0111 keV, and their flux ratio 1:2, Bearden 1967) and the Kβ. All line widths were kept fixed to 0. The whole model was convolved with a Gaussian smoothing (model gsmooth in xspec), with free sigma. The best fit values for the gsmooth σ were 62 ± 6 and 48 ± 6 eV, for the two data-sets. We therefore adopted gsmooth and the mean σ = 55 eV to correct the pn spectrum of NGC 424.
With this correction, the line width of the neutral Fe Kα line is
still resolved ( eV). We then added a Compton Shoulder
(CS) redwards of the line core, as expected on theoretical ground, modelled as another
Gaussian line, with energy fixed at 6.3 keV and σ = 40 eV (e.g. Matt 2002). Although the CS is not required by the
data (Δχ2 = 1), its flux is 25 ± 9% of the flux of the
narrow core, consistent with the expectations, and the narrow core of the
Fe Kα line is now unresolved (σ < 60 eV). In
Table 2 all the best fit results of the hard-X
spectrum can be found and in Fig. 3 the best fit
plot is shown, with a resulting
χ2/d.o.f. = 49/58.
eV). We then added a Compton Shoulder
(CS) redwards of the line core, as expected on theoretical ground, modelled as another
Gaussian line, with energy fixed at 6.3 keV and σ = 40 eV (e.g. Matt 2002). Although the CS is not required by the
data (Δχ2 = 1), its flux is 25 ± 9% of the flux of the
narrow core, consistent with the expectations, and the narrow core of the
Fe Kα line is now unresolved (σ < 60 eV). In
Table 2 all the best fit results of the hard-X
spectrum can be found and in Fig. 3 the best fit
plot is shown, with a resulting
χ2/d.o.f. = 49/58.
We checked the previous result by analysing the MOS spectra in the high energy band (5–10 keV). Lines’ fluxes and energy centroids are fully consistent with the values presented in Table 2. The width of the neutral Fe Kα line is σ < 50 eV and the narrow core of the line is unresolved, for a best fit of χ2 = 35/36 d.o.f.
If we consider the neutral Fe Kα line resolved, without any Compton
Shoulder redwards of the line core, we get a eV. With this result considerations on
the geometry of the inner radius of the molecular torus can be drawn. If we assume that
the torus has a Keplerian motion around the central super massive black hole, it is easy
to show that the expected FWHM of a line produced in its inner walls
should follow the relation
2vksini ≃ 1300(M8/r)1/2sini km s, where the radius is expressed in
parsec, the mass is in 108 M⊙ units
and i is the angle between the torus axis and the line of sight. The
black hole mass of NGC 424 is estimated by means of stellar velocity dispersion to be
6.02 × 10⁷ M⊙ (e.g. Bian & Gu 2007). This means that the expected FWHM
for the iron line in this source is
1010 r−1/2sini km s. If the
 km s we measure with the EPIC pn is due to
Doppler broadening5, we can estimate the inner
radius of the torus:
km s we measure with the EPIC pn is due to
Doppler broadening5, we can estimate the inner
radius of the torus:  pc. For different choices
of i of 30
pc. For different choices
of i of 30 or
60 we get central values of 0.01 and
0.03 pc, respectively, for the inner radius.
or
60 we get central values of 0.01 and
0.03 pc, respectively, for the inner radius.
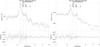 |
Fig. 3 Best-Fit of the hard-X (5–10 keV) EPIC pn (left) and MOS (right) spectrum. |
EPIC pn phenomenological fit (5–10 keV). See text for details.
We can use the best fit results to provide estimates on the neutral gas parameters,
such as the Fe and Ni abundance, and the ionisation state. The iron abundance is
measured by the depth of the iron edge in the Compton reflection continuum, and it is
measured with respect to the elements responsible for the photoabsorption below the
edge, mainly oxygen and neon but with not negligible contributions from magnesium,
silicon and sulphur. Leaving this parameter free to vary in the best fit, we can measure
it with high statistical precision, i.e.  in solar units (e.g. Anders & Grevesse 1989). From the observed
Ni Kα to Fe Kα line fluxes, we can instead estimate
the relative abundances of the two elements. The expected ratio ranges from 0.03
to 0.045, depending on the inclination angle and the incident power-law index, as
discussed in Molendi et al. (2003). In our case,
we measure 0.12 ± 0.05 (considering only the flux of the iron Kα core
line, excluding the CS), significantly higher than the expected one, indicating a
nickel-to-iron overabundance by a factor ≃2. This result agrees fully with previous
studies on high energy spectra performed on similar Compton thick Seyfert 2 galaxies,
such as NGC 1068 (Matt et al. 2004) and Mrk 3
(Bianchi et al. 2005). The presence of an
Fe Kβ line at 7.058 keV is not statistically required, leading to an
FeKβ/FeKα (core only) ratio ≲ 0.10. The expected
value is higher, from 0.155 to 0.16 (Molendi et al.
2003), suggesting a moderate ionisation of the gas responsible for iron
fluorescence.
in solar units (e.g. Anders & Grevesse 1989). From the observed
Ni Kα to Fe Kα line fluxes, we can instead estimate
the relative abundances of the two elements. The expected ratio ranges from 0.03
to 0.045, depending on the inclination angle and the incident power-law index, as
discussed in Molendi et al. (2003). In our case,
we measure 0.12 ± 0.05 (considering only the flux of the iron Kα core
line, excluding the CS), significantly higher than the expected one, indicating a
nickel-to-iron overabundance by a factor ≃2. This result agrees fully with previous
studies on high energy spectra performed on similar Compton thick Seyfert 2 galaxies,
such as NGC 1068 (Matt et al. 2004) and Mrk 3
(Bianchi et al. 2005). The presence of an
Fe Kβ line at 7.058 keV is not statistically required, leading to an
FeKβ/FeKα (core only) ratio ≲ 0.10. The expected
value is higher, from 0.155 to 0.16 (Molendi et al.
2003), suggesting a moderate ionisation of the gas responsible for iron
fluorescence.
The detection of the Fe xxvi Kα emission line requires the
presence of another gas with very different physical properties from the one responsible
for neutral fluorescence and the Compton reflection continuum. Given the limited
statistics and the upper limits on the Fe xxv Kα triplet, both
a pure photoionised Compton-thin material ( and
and
 , adopting the same model described in
Sect. 3.2) and a plasma in collisional
equilibrium (
, adopting the same model described in
Sect. 3.2) and a plasma in collisional
equilibrium ( keV, model apec) reproduce the
emission line equally well, with a final χ2 statistically
equivalent to the phenomenological best fit.
keV, model apec) reproduce the
emission line equally well, with a final χ2 statistically
equivalent to the phenomenological best fit.
3.3.2. Broad band EPIC pn spectrum (0.5–10 keV)
Taking into account the results from the soft X-ray RGS spectrum, we finally performed a self-consistent fit in the whole EPIC pn band (0.5–10 keV). The model for the high energy spectrum is the same that we adopted in the previous section, including a photoionisation component needed to reproduce for the Fe xxvi Kα emission line. As for the soft X-ray emission spectrum, we adopted the same model which successfully reproduce the RGS spectrum, consisting in two photoionisation components (we fixed for all the components the same velocity shift measured in the RGS analysis). The overall fit is marginally acceptable (χ2 = 256/167 d.o.f.), due to some residuals suggesting the presence of emission lines not reproduced by our model.
Indeed, the addition of a line at 1.16 ± 0.01 keV is significantly required (Δχ2 = 51), its flux of 3.4 ± 0.8 × 10⁻⁶ ph cm-2 s-1, agrees with the Fe xviii and Fe xvii L blend observed in the phenomenological analysis of the RGS spectrum (see Table 1). Another emission line, at 2.44 ± 0.02 keV, with flux 1.1 ± 0.4 × 10⁻⁶ ph cm-2 s-1, improves the fit (Δχ2 = 5). It can be identified with a blend of the S xv triplet (2.430, 2.448, 2.461 keV)6. More marginal detections are found at 3.13 ± 0.05 keV (Δχ2 = 4), identified with the Ar xvii Kα triplet (3.104, 3.125, and 3.140 keV), 3.88 ± 0.04 keV (Δχ2 = 9), i.e. the Ca xix Kα triplet (3.861, 3.883, and 3.888 keV), and at 5.37 ± 0.07 keV (Δχ2 = 4), consistent with Kα fluorescence from neutral Cr (5.412 keV). The emission line of another high ionisation potential species is under-predicted, i.e. Fe xxvi. This suggests that the gas component with the highest ionisation parameter is likely more complex, and cannot be easily modelled with a single phase, which is not able to reproduce all the observed emission.
The final fit is good (χ2 = 183/162 d.o.f.). The best fit
values for the three photoionisation components are7:  ,
log NH1 > 23.3;
,
log NH1 > 23.3;  ,
log NH2 = 20.4 ± 0.5;
,
log NH2 = 20.4 ± 0.5;
 ,
,  . The intermediate component agrees fully
with the one found in the RGS analysis (see Sect. 3.2), both the least and the most ionised component have lower ionisation
parameters than those extracted from the analysis in the bands where they dominate. This
is due to the not negligible contribution of the high ionisation component to the soft
X-ray emission, reflecting the possibility that, as already mentioned above, the
modelling in three separate phases is too simple, and more complex geometrical and
physical dependencies between these components are needed in order to reproduce at the
same time all the observed features in the broad band.
. The intermediate component agrees fully
with the one found in the RGS analysis (see Sect. 3.2), both the least and the most ionised component have lower ionisation
parameters than those extracted from the analysis in the bands where they dominate. This
is due to the not negligible contribution of the high ionisation component to the soft
X-ray emission, reflecting the possibility that, as already mentioned above, the
modelling in three separate phases is too simple, and more complex geometrical and
physical dependencies between these components are needed in order to reproduce at the
same time all the observed features in the broad band.
As a self-consistent check, we extrapolated our X-ray best fit for the photoionised components to the optical band, in order to compare the predicted [O iii] flux with the observed one. Our model produces an excess in this emission line, by a factor of 16 ± 8, taking into account the errors on our best fit. The comparison was made with the reddening-corrected [O iii] flux (Murayama et al. 1998), so the discrepancy is intrinsic, and not due to the reddening of the NLR. Moreover, no additional neutral absorption at the redshift of the source is required in our best fit (NH < 1.6 × 1020 cm-2), at odds with the measured AV ~ 1.4 to the NLR (Murayama et al. 1998), and differently from what found by Matt et al. (2003), although with a much simpler modelling of the soft X-ray emission. The only contribution to the [O iii] flux in our best fit model comes from the photoionised component with the lower ionisation parameter. In the X-ray band, this phase produces mostly O vii emission, but also strong emission lines from quasi-neutral S, Si, and Mg (see also Fig. 4). A significant contribution to these lines likely comes from the Compton-thick material producing the neutral iron Kα line, but they are completely fitted by the low photoionised phase in our model. Consequently, its flux may be higher than expected, producing part of the observed discrepancy in the [O iii] emission line. It should also be noted that, in order to perform a detailed comparison between the optical and the X-ray emission of the NLR, a much better modelling of the spectral energy distribution of NGC 424 should be adopted in the cloudy models, but this is beyond the scopes of this paper.
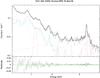 |
Fig. 4 XMM-Newton EPIC pn 0.5–10 keV best fit and residuals. All the model components are shown: pure Compton reflection (grey), absorbed primary powerlaw (magenta), low photoionised component (light blue), medium photoionised component (blue), high photoionised component (green), Gaussian lines (red). See text for details. |
Finally, the intrinsic 2–10 keV luminosity of NGC 424 is 4.2 × 1042 erg s-1, absorbed by a neutral column density of 1.1 ± 0.2 × 1024 cm-2, it roughly agrees with the value measured by Iwasawa et al. (2001). The 2–10 keV luminosity of the Compton reflection component is 9.6 × 1040 erg s-1, about an half of the reflection expected from a slab subtending at 2π. Note that the absorption includes Compton scattering only along the line-of-sight (model cabs), so the derived intrinsic luminosity can be considered an upper limit to the real one, depending on the covering factor of the absorber, and, thus, the reflection fraction is likely higher than ≃0.5. Measuring the reflection fraction in Compton thick AGN is obviously impossible besides the few cases (such as NGC 424) in which the intrinsic continuum is not totally obscured below 10 keV. However R ≃ 0.5 is in line with the typical reflection fraction of the distant reflection component observed in unobscured Seyfert 1 galaxies (Nandra et al. 2007, e.g.) supporting the standard view that distant reflection in both obscured and unobscured AGN arises in one and the same medium with similar global covering factor.
Adopting the X-ray bolometric correction presented in Marconi et al. (2004), we can estimate the bolometric luminosity of NGC 424 from the intrinsic 2–10 keV as Lbol = 5.9 × 1043 erg s-1. This value agrees with the one that we can derive from the [O iii] luminosity, once corrected for reddening, extracted from the optical data in Murayama et al. (1998), and adopting the bolometric correction proposed by Lamastra et al. (2009): Lbol = 5.1 × 1043 erg s-1. Assuming the BH mass already mentioned in Sect. 3.3.1, the accretion rate of the source is therefore ṁ ≃ 6.7−7.5 × 10⁻³ in Eddington units.
4. Conclusions
We presented the XMM-Newton RGS and EPIC pn spectra of a long observation
of the Seyfert 2 galaxy, NGC 424. The high-energy part of the spectrum confirmed its nature
as a Compton-thick source, dominated by a pure neutral Compton reflection component, and a
neutral iron Kα line with a very large EW, together with
strong Kα emission from neutral Ni, suggesting a significant Ni/Fe
overabundance. From the width of the neutral iron Kα line we estimated the
inner radius of the torus: pc, where i is the
inclination angle between the torus axis and the line of sight. The presence of
Fe xxvi Kα emission can be reproduced equally well by a plasma
in collisional or photoionisation equilibrium, given that only upper limits can be recovered
on emission from Fe xxv.
The soft X-ray RGS spectrum of NGC 424 comes mostly from line emission from H-like and He-like C, N, O, and Ne, as well as from the Fe L-shell, as commonly found in obscured AGN (e.g. Guainazzi & Bianchi 2007). The presence of narrow RRC from O viii, O vii, and C vi (the latter two with resolved widths corresponding to temperatures around 5–10 eV) is a strong indication of a low-temperature gas, which must therefore be in photoionisation equilibrium to have such an high ionisation state. This is confirmed by the prevalence of the forbidden component in the O vii triplet. Indeed, a self-consistent photoionisation model well reproduces the RGS spectrum, adopting two gas phases with different ionisation parameters. This gas is likely to be identified with the ionisation cones of the NLR, as suggested for most Seyfert 2 galaxies (e.g. Kinkhabwala et al. 2002; Schurch et al. 2004; Bianchi et al. 2010), although a contribution from inner regions (i.e. the torus, the BLR) cannot be ruled out. Any contribution from a gas in collisional equilibrium should not exceed 10% of the total flux in the 0.35–1.55 keV band.
When this self-consistent model is applied to the 0.5–10 keV band of the EPIC pn spectrum, a third photoionised phase is
needed to account for emission lines with higher ionisation potential, although Kα emission from S xv and Fe xxvi remains under-predicted.
We also used the IUE UV fluxes reported by Dunn et al. (2006) to estimate an αox ≃ 1.2. Since this value is strongly dependent on the intrinsic X-ray flux of NGC 424, which is not directly observed, we decided to adopt a well-known standard continuum model, with an αox = 1.4, which is not significantly different from the one suggested by the data for this source.
Hazy 1 version 08, p. 67: http://viewvc.nublado.org/index.cgi/tags/release/c08.00/docs/hazy1_08.eps?revision=2342&root=cloudy
We note here that a line wavelength does correspond to a known defective pixel in one of the RGS cameras (http://xmm.esac.esa.int/external/xmm_user_support/documentation/uhb/node59.html#3177)
Many of the following emission lines are indeed doublets, with a fixed intensity ratio between the two components of 1:2, and the given energies are the weighted mean (based on the values reported by Bearden 1967). As already shown by Yaqoob et al. (2001) and Bianchi et al. (2005), given the small energy distance between the two components, the width of the line is unaffected by the modelling with a single Gaussian with current X-ray instruments.
Acknowledgments
A.M., S.B., G.M. and E.P. acknowledge financial support from ASI (grant I/088/06/0). We would like to thank Matteo Guainazzi for very useful discussions on EPIC calibration issues.
References
- Anders, E., & Grevesse, N. 1989, Geochim. Cosmochim. Acta, 53, 197 [Google Scholar]
- Arnaud, K. A. 1996, in Astronomical Data Analysis Software and Systems V, ASP Conf. Ser., 101, 17 [Google Scholar]
- Bearden, J. A. 1967, Rev. Mod. Phys., 39, 78 [NASA ADS] [CrossRef] [Google Scholar]
- Bian, W., & Gu, Q. 2007, ApJ, 657, 159 [NASA ADS] [CrossRef] [Google Scholar]
- Bianchi, S., Miniutti, G., Fabian, A. C., & Iwasawa, K. 2005, MNRAS, 360, 380 [NASA ADS] [CrossRef] [Google Scholar]
- Bianchi, S., Chiaberge, M., Evans, D. A., et al. 2010, MNRAS, 405, 553 [NASA ADS] [Google Scholar]
- Brown, G. V., Beiersdorfer, P., Liedahl, D. A., Widmann, K., & Kahn, S. M. 1998, ApJ, 502, 1015 [NASA ADS] [CrossRef] [Google Scholar]
- Cash, W. 1976, A&A, 52, 307 [NASA ADS] [Google Scholar]
- Collinge, M. J., & Brandt, W. N. 2000, MNRAS, 317, L35 [NASA ADS] [CrossRef] [Google Scholar]
- Dere, K. P., Landi, E., Mason, H. E., Monsignori, F. B. C., & Young, P. R. 1997, A&AS, 125, 149 [NASA ADS] [CrossRef] [EDP Sciences] [Google Scholar]
- Dere, K. P., Landi, E., Young, P. R., et al. 2009, A&A, 498, 915 [NASA ADS] [CrossRef] [EDP Sciences] [Google Scholar]
- Dickey, J. M., & Lockman, F. J. 1990, ARA&A, 28, 215 [NASA ADS] [CrossRef] [MathSciNet] [Google Scholar]
- Dunn, J. P., Jackson, B., Deo, R. P., et al. 2006, PASP, 118, 572 [NASA ADS] [CrossRef] [Google Scholar]
- Ferland, G. J., Korista, K. T., Verner, D. A., et al. 1998, PASP, 110, 761 [Google Scholar]
- Gabriel, C., Denby, M., Fyfe, D. J., et al. 2004, in Astronomical Data Analysis Software and Systems (ADASS) XIII, ed. F. Ochsenbein, M. G. Allen, & D. Egret, ASP Conf. Ser., 314, 759 [Google Scholar]
- Guainazzi, M., & Bianchi, S. 2007, MNRAS, 374, 1290 [NASA ADS] [CrossRef] [Google Scholar]
- Iwasawa, K., Matt, G., Fabian, A. C., et al. 2001, MNRAS, 326, 119 [NASA ADS] [CrossRef] [Google Scholar]
- Kinkhabwala, A., Sako, M., Behar, E., et al. 2002, ApJ, 575, 732 [NASA ADS] [CrossRef] [Google Scholar]
- Korista, K., Baldwin, J., Ferland, G., & Verner, D. 1997, ApJS, 108, 401 [NASA ADS] [CrossRef] [Google Scholar]
- Lamastra, A., Bianchi, S., Matt, G., et al. 2009, A&A, 504, 73 [NASA ADS] [CrossRef] [EDP Sciences] [Google Scholar]
- Malkan, M. A., Gorjian, V., & Tam, R. 1998, ApJS, 117, 25 [NASA ADS] [CrossRef] [Google Scholar]
- Marconi, A., Risaliti, G., Gilli, R., et al. 2004, MNRAS, 351, 169 [NASA ADS] [CrossRef] [Google Scholar]
- Matt, G. 2000, A&A, 355, L31 [NASA ADS] [Google Scholar]
- Matt, G. 2002, Roy. Soc. London Philosoph. Trans. Ser. A, 360, 2045 [Google Scholar]
- Matt, G., Guainazzi, M., Maiolino, R., et al. 1999, A&A, 341, L39 [NASA ADS] [Google Scholar]
- Matt, G., Fabian, A. C., Guainazzi, M., et al. 2000, MNRAS, 318, 173 [NASA ADS] [CrossRef] [Google Scholar]
- Matt, G., Bianchi, S., Guainazzi, M., et al. 2003, A&A, 399, 519 [NASA ADS] [CrossRef] [EDP Sciences] [Google Scholar]
- Matt, G., Bianchi, S., Guainazzi, M., & Molendi, S. 2004, A&A, 414, 155 [NASA ADS] [CrossRef] [EDP Sciences] [Google Scholar]
- Molendi, S., Bianchi, S., & Matt, G. 2003, MNRAS, 343, L1 [NASA ADS] [CrossRef] [Google Scholar]
- Moran, E. C., Barth, A. J., Kay, L. E., & Filippenko, A. 2000, ApJ, 540, L73 [NASA ADS] [CrossRef] [Google Scholar]
- Murayama, T., Taniguchi, Y., & Iwasawa, K. 1998, AJ, 115, 460 [Google Scholar]
- Nandra, K., O’Neill, P. M., George, I. M., & Reeves, J. N. 2007, MNRAS, 382, 194 [NASA ADS] [CrossRef] [Google Scholar]
- Nicastro, F., Fiore, F., & Matt, G. 1999, ApJ, 517, 108 [NASA ADS] [CrossRef] [Google Scholar]
- Osterbrock, D., & Ferland, G. J. 2006, Astrophysics of gaseous nebulae and active galactic nuclei, ed. D. E. Osterbrock, & G. J. Ferland [Google Scholar]
- Piconcelli, E., Jimenez-Bailón, E., Guainazzi, M., et al. 2004, MNRAS, 351, 161 [NASA ADS] [CrossRef] [Google Scholar]
- Porquet, D., & Dubau, J. 2000, A&AS, 143, 495 [NASA ADS] [CrossRef] [EDP Sciences] [Google Scholar]
- Pounds, K. A., & Page, K. L. 2005, MNRAS, 360, 1123 [NASA ADS] [CrossRef] [Google Scholar]
- Sako, M., Kahn, S. M., Paerels, F., & Liedahl, D. A. 2000, ApJ, 543, L115 [NASA ADS] [CrossRef] [Google Scholar]
- Sambruna, R. M., Netzer, H., Kaspi, S., et al. 2001, ApJ, 546, L13 [NASA ADS] [CrossRef] [Google Scholar]
- Schurch, N. J., Warwick, R. S., Griffiths, R. E., & Kahn, S. M. 2004, MNRAS, 350, 1 [NASA ADS] [CrossRef] [Google Scholar]
- Strüder, L., Briel, U., Dennerl, K., et al. 2001, A&A, 365, L18 [NASA ADS] [CrossRef] [EDP Sciences] [Google Scholar]
- Turner, M. J. L., Abbey, A., Arnaud, M., et al. 2001, A&A, 365, L27 [NASA ADS] [CrossRef] [EDP Sciences] [Google Scholar]
- Yaqoob, T., George, I. M., Nandra, K., et al. 2001, ApJ, 546, 759 [NASA ADS] [CrossRef] [Google Scholar]
All Tables
All Figures
|
Fig. 1 RGS1 spectrum and best fit model for the phenomenological analysis: the O vii triplet. The three transitions are labelled. |
| In the text | |
|
Fig. 2 RGS1 (black) and RGS2 (red) self-consistent best fit (see text for detail). The 8–20 Å spectrum is shown in top panel, the 20–35 Å one in bottom panel. |
| In the text | |
|
Fig. 3 Best-Fit of the hard-X (5–10 keV) EPIC pn (left) and MOS (right) spectrum. |
| In the text | |
|
Fig. 4 XMM-Newton EPIC pn 0.5–10 keV best fit and residuals. All the model components are shown: pure Compton reflection (grey), absorbed primary powerlaw (magenta), low photoionised component (light blue), medium photoionised component (blue), high photoionised component (green), Gaussian lines (red). See text for details. |
| In the text | |
Current usage metrics show cumulative count of Article Views (full-text article views including HTML views, PDF and ePub downloads, according to the available data) and Abstracts Views on Vision4Press platform.
Data correspond to usage on the plateform after 2015. The current usage metrics is available 48-96 hours after online publication and is updated daily on week days.
Initial download of the metrics may take a while.