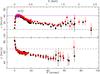
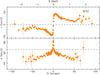
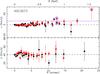
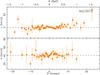
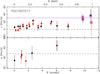
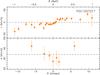
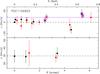
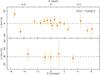
Fig. 6

Kinematic profiles of the galaxy sample. Each diagram shows the folded rotation curve of the galaxy in the left upper panel and in the left bottom panel the folded velocity dispersion profile. The different sides of the galaxy are indicated with red squares and black dots. The upper x-axis gives the radius as a fraction of the effective radius (Reff) of each galaxy in the I band (see Sect. 6). The purple open squares show the points used to calculate the maximum rotation for each galaxy and the purple line indicates this vmax. The dashed line in the velocity dispersion profiles indicates the central σ computed up to the Reff (see Table 4). In the right panels the not-folded kinematical profiles are plotted.
Current usage metrics show cumulative count of Article Views (full-text article views including HTML views, PDF and ePub downloads, according to the available data) and Abstracts Views on Vision4Press platform.
Data correspond to usage on the plateform after 2015. The current usage metrics is available 48-96 hours after online publication and is updated daily on week days.
Initial download of the metrics may take a while.