Fig. 9
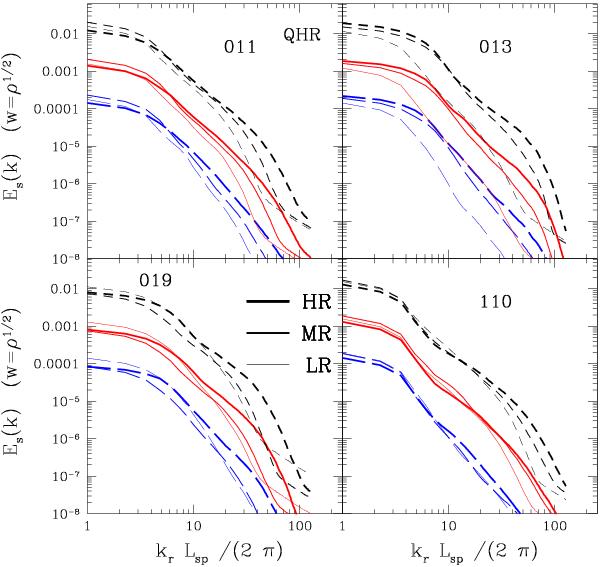
Shearing components of the density-weighted velocity power spectra are shown at z = 0 for the runs of the relaxed test clusters as a function of the wavenumber. As in the previous figures, different line styles are for different AV runs. In each panel runs with different resolution are displayed with different line thickness. For the sake of clarity, not all of the AV runs are plotted and runs with different AV parameters have been equispaced from top to bottom by a factor of 10. To more clearly illustrate the wavenumber dependence, spectra have been computed here using  grid points.
Current usage metrics show cumulative count of Article Views (full-text article views including HTML views, PDF and ePub downloads, according to the available data) and Abstracts Views on Vision4Press platform.
Data correspond to usage on the plateform after 2015. The current usage metrics is available 48-96 hours after online publication and is updated daily on week days.
Initial download of the metrics may take a while.