Fig. 5
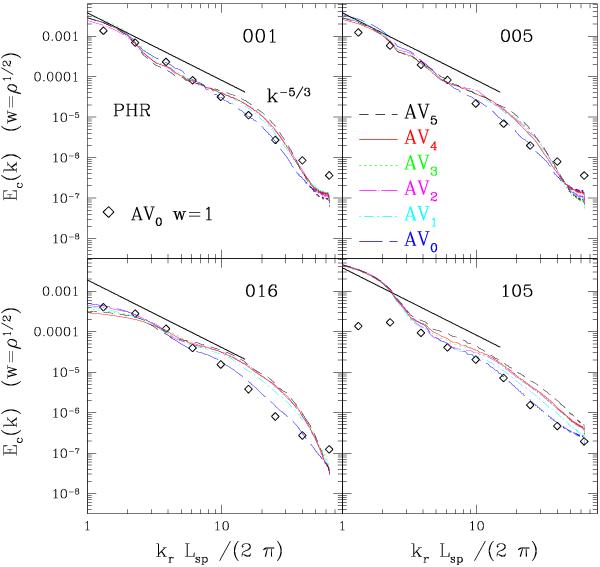
Compressive components of the density-weighted velocity power spectra (20) are shown at z = 0 as a function of the dimensionless wavenumber  , where kr = |k|. The spectra are extracted from the high resolution (HR) runs of the four dynamically perturbed test clusters using a cube of size Lsp = r200 with
  grid points and are shown up to the wavenumber
  . In each panel, different lines refer to runs with different AV viscosity parameters, the line style and color coding is the same as in the previous figures. The solid black line indicates the Kolgomorov scaling, while open diamonds correspond to the volume-weighted velocity power spectrum of the standard AV runs.
Current usage metrics show cumulative count of Article Views (full-text article views including HTML views, PDF and ePub downloads, according to the available data) and Abstracts Views on Vision4Press platform.
Data correspond to usage on the plateform after 2015. The current usage metrics is available 48-96 hours after online publication and is updated daily on week days.
Initial download of the metrics may take a while.