Free Access
Fig. 15
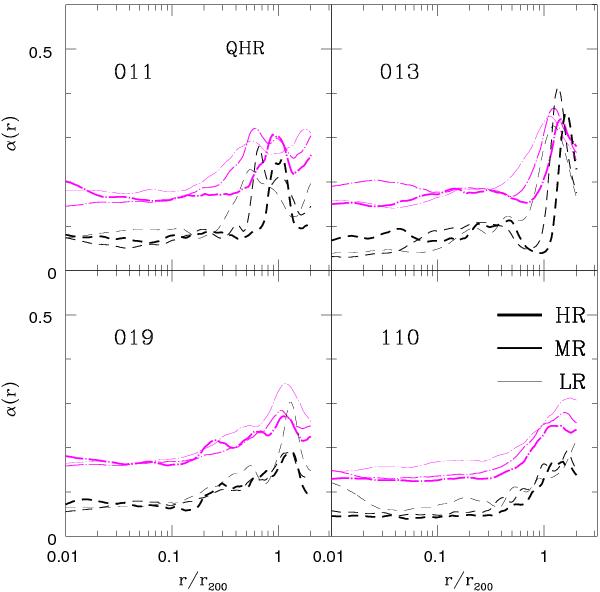
As in Fig. 9, final profiles of the viscosity parameter α are shown for the runs of the relaxed test clusters with different AV parameters and resolution. In each cluster panel the profiles have been plotted without any shifting between the various cases.
Current usage metrics show cumulative count of Article Views (full-text article views including HTML views, PDF and ePub downloads, according to the available data) and Abstracts Views on Vision4Press platform.
Data correspond to usage on the plateform after 2015. The current usage metrics is available 48-96 hours after online publication and is updated daily on week days.
Initial download of the metrics may take a while.