Free Access
Fig. 10
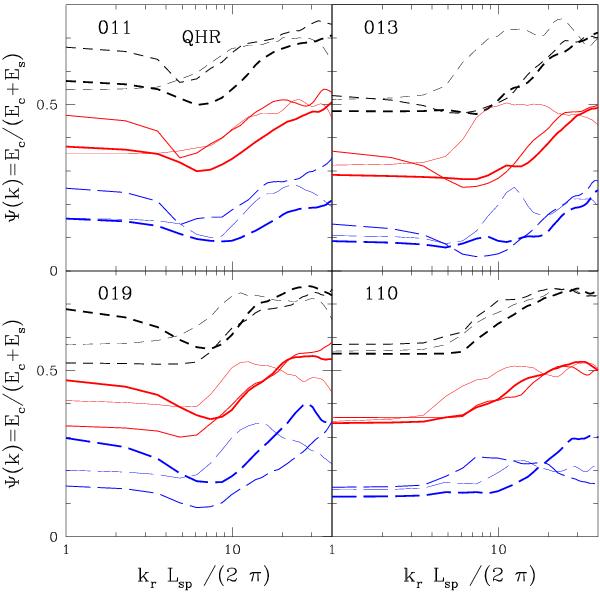
The ratio of the longitudinal to total velocity power spectra are shown at z = 0 for runs of the relaxed test clusters as a function of the wavenumber. The line coding is the same as in the previous figure; runs with different AV parameters have been equispaced from top to bottom by a factor 0.2.
Current usage metrics show cumulative count of Article Views (full-text article views including HTML views, PDF and ePub downloads, according to the available data) and Abstracts Views on Vision4Press platform.
Data correspond to usage on the plateform after 2015. The current usage metrics is available 48-96 hours after online publication and is updated daily on week days.
Initial download of the metrics may take a while.